API Functional Test Report
Once an API Functional Test run, this report will show you the results of your test to validate your APIs.
Report Summary
The dashboard above shows how many responses passed and failed, how many errors were identified, and how many assertions failed, if any. Each request is, in fact, a 'test', in this context.
Click the toggle to filter the response to only see failed requests: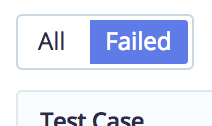
To the right, you will find links to test artifact and log files: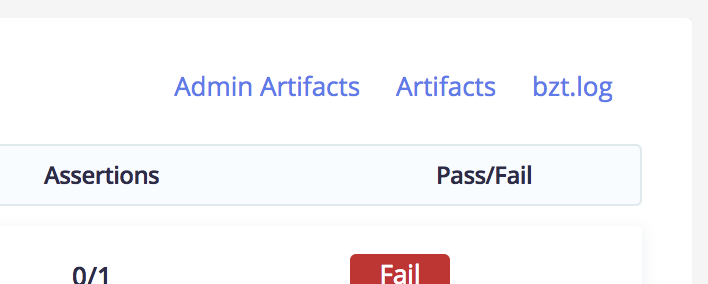
Under 'Test Case', you will see the script's scenarios (if run on JMeter, then scenarios correlate to Thread Groups). By opening them you will see the requests they contain.
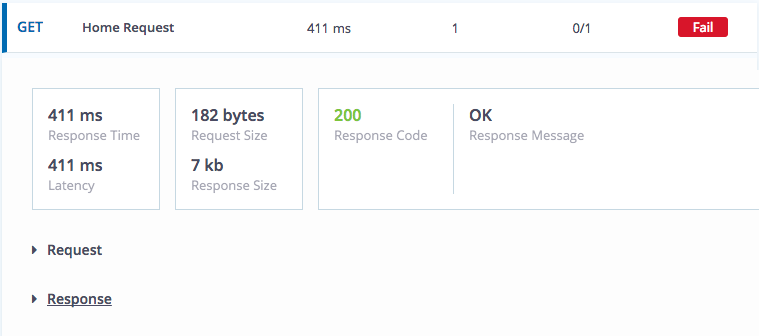
Each 'test' is a label in the test plan. When you open it, you will see a summary of this label's response time, latency, request and response sizes, and the response code and message:
Let's look at the request and response of the following test.
Request Data
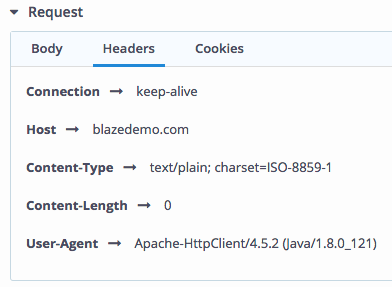
Looking into the request for this test, you can see the body (if you sent a body with the request), the headers, and the cookies:
Response Data
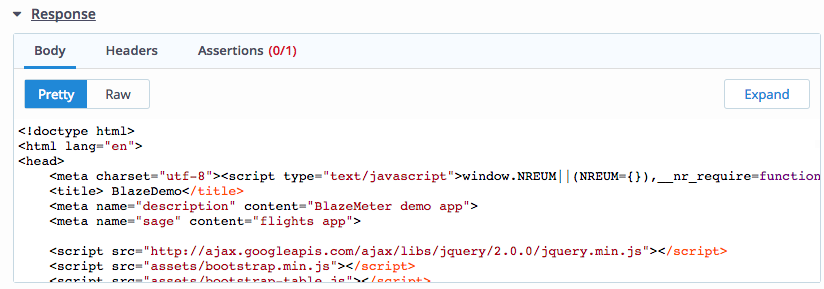
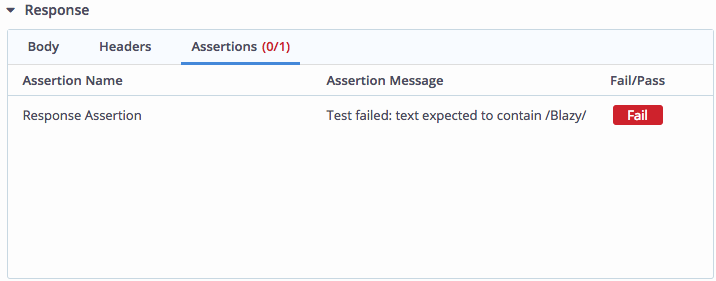
Looking into the response to this test, you can see the response body, headers, and whether your assertion passed or failed (and why it failed):
Report History
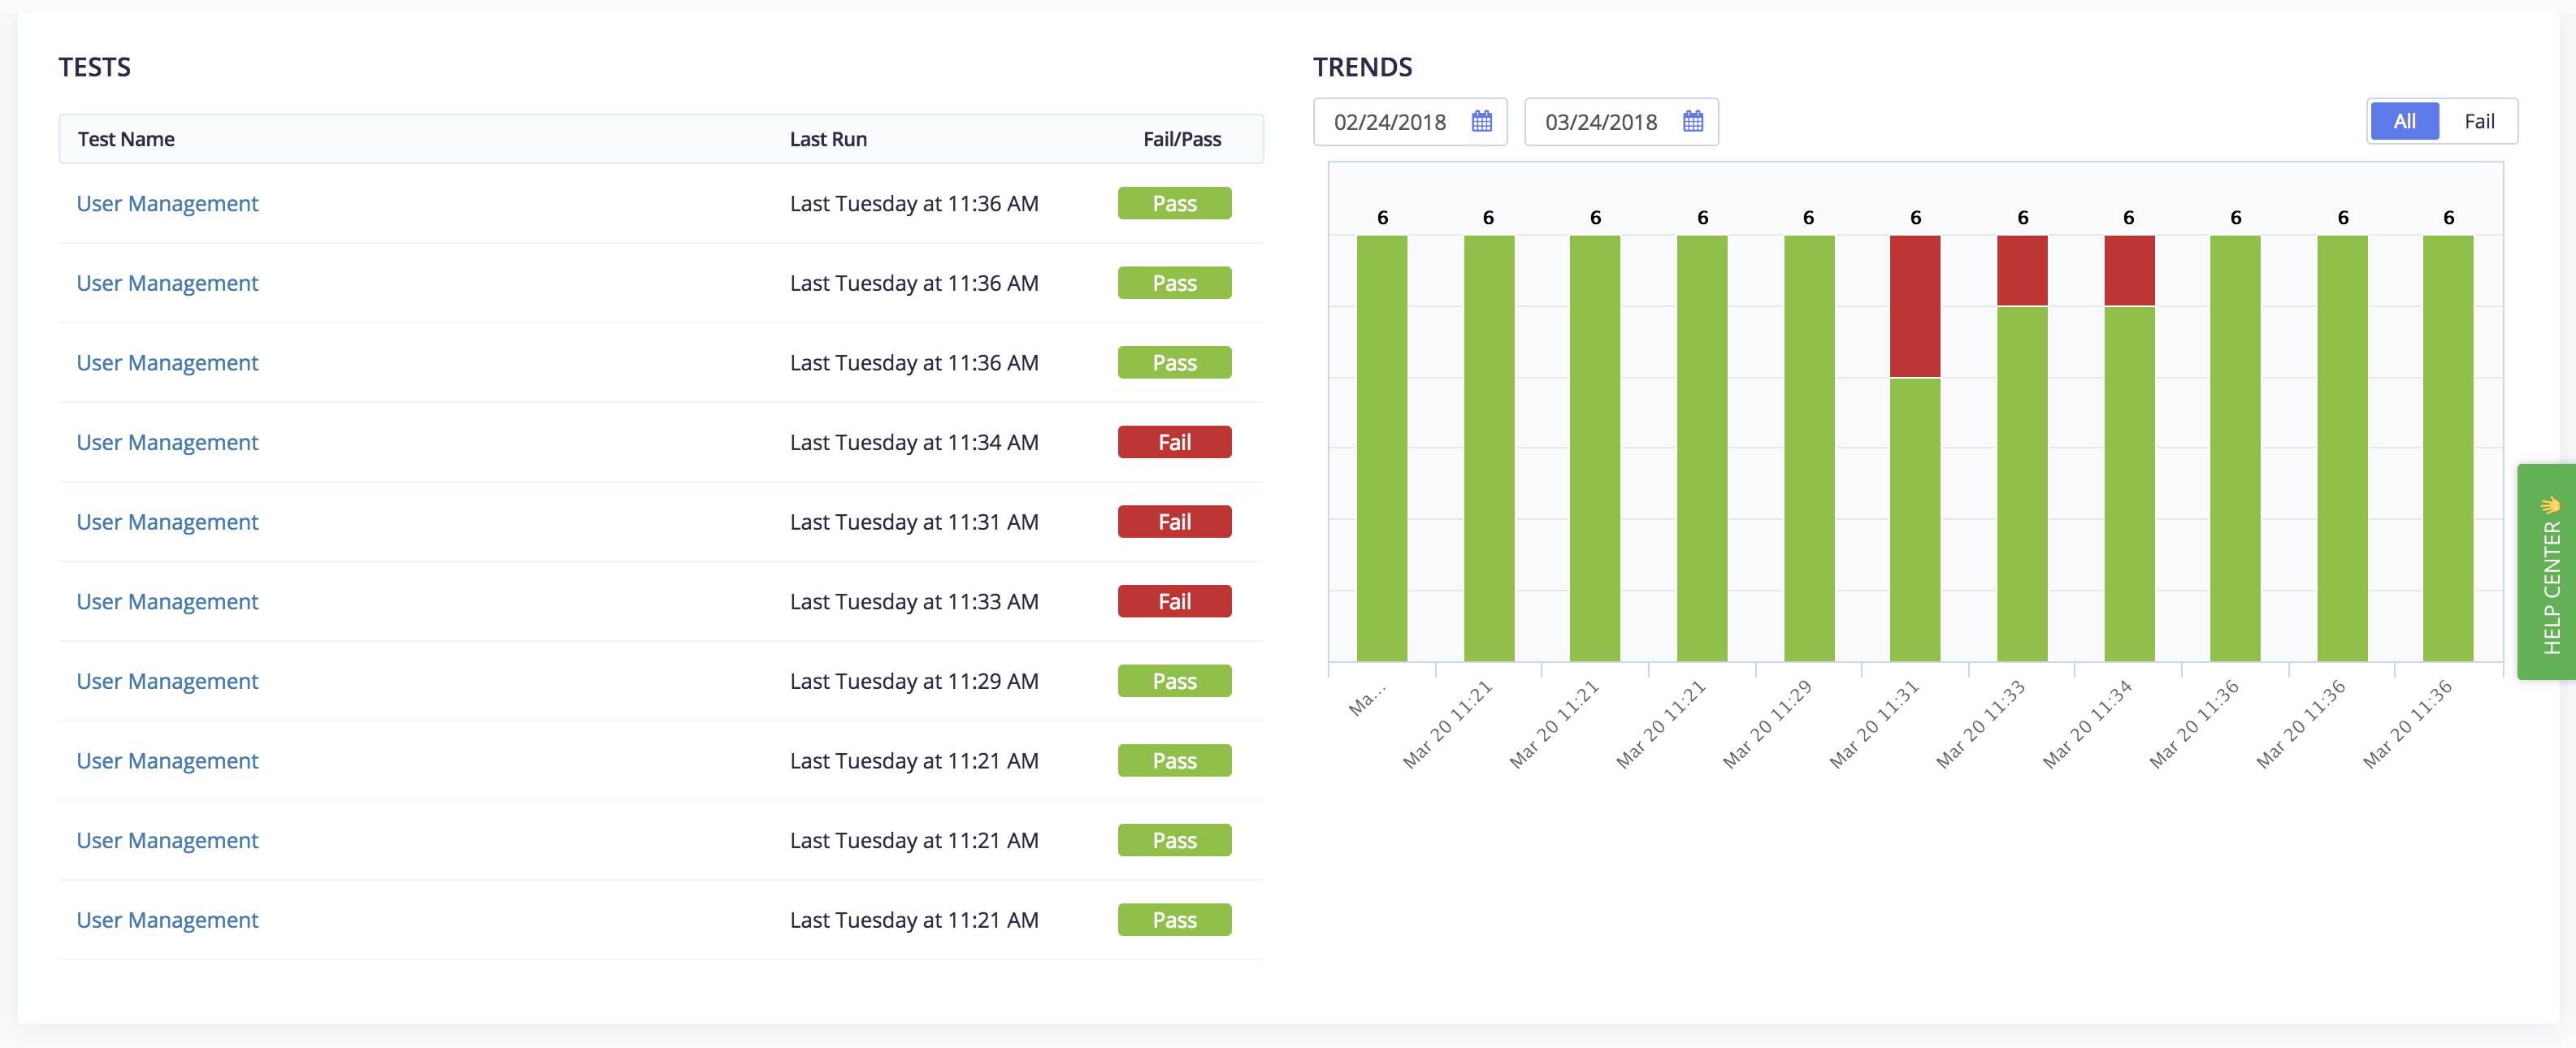
In the "History" view you can see an overview of past test runs including which passed and failed and how many requests passed and failed. Click on a row or on one of the bars to the right to see the details of an individual test run:
Sharing Reports
You can share your report with others!
- Click the button to the right of the report title that appears as three dots.
- Select "Share Report".
- Toggle "Sharing for this report is:" to "ON".
- Copy and share your report link.

