Debug scriptless GUI functional tests
The scriptless editor has a built-in local debugger, separate from the GUI functional test debugger. Developers use debuggers to step through and troubleshoot broken tests.
How to interactively debug a scriptless scenario locally
- Go to the Functional tab, open the broken test and go to its Configuration tab.
- Turn the local debugger on.
Now the Play button is enabled.
- (Optional) Click Toggle breakpoint on steps where you want to pause execution to troubleshoot.

- Click the Play button to start the debugger.
The Play button turns into a Pause button. - Wait for the debugger to open in a new browser window.
- Resize or move the BlazeMeter window and the Debugger window, so you can see both.
- Watch how BlazeMeter executes the test scenario and color-codes the debug results.
- A green checkbox marks a step that has been executed.
- A yellow edge marks a step that is being executed.
- A green edge marks a step that has completed.
- A red edge and red exclamation mark marks a step that has failed.
- The colored marks are reset when you click Play or Stop.
- Hover over Info symbols to read warnings and informational messages, for example, if the first locator was not found, and secondary etc. locator was used instead.
- Click Stop to close the debugger.
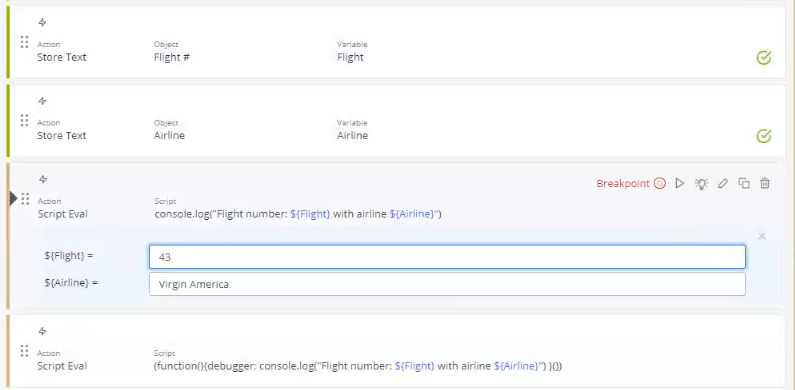
The following screenshot shows how you can interactively edit variable values while the local debugger is running. Left-click the blue highlighted variable name to open the inline editor:
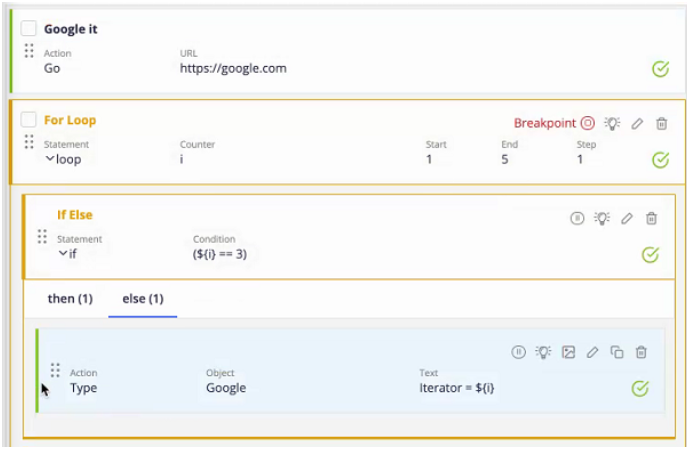
The following screenshot shows a successfully completed Go Step, and a running For Loop step with a breakpoint. You can tell by the green checkmark that the action inside the running step has completed.
The following screenshot shows a failed step. Hover over the exclamation mark to see error details:
How to use breakpoints
If you have set a breakpoint on a step, it means that execution pauses there, so you can investigate.
In your investigation, you can modify steps while the debugger is running. When you reach a breakpoint, you can modify the executed step, or any step after it. You can also modify steps before the breakpoint, but that won't affect this run of the debugger.
Click Play anytime to continue execution after pausing at a breakpoint; or click Stop to close the debugger.
Additionally, you have the following options when pausing at groups, loops, and if/else blocks:
- Step in - Step into the group, loop, or if/else block, and pause again.
- Step over - Execute the group, loop, or if/else block, and pause again.
- Step out - Step out of the current group, loop, or if/else block, and pause again.


