Integrate with DynaTrace APM
Dynatrace is an Application Performance Monitoring (APM) tool designed for analyzing the performance of application servers, database servers, and web services.
BlazeMeter offers two integration options with Dynatrace:
- Anonymous integration: BlazeMeter sets up a test that sends HTTP requests to your monitored servers, and the resulting monitoring KPIs are instantly accessible within your Dynatrace application.
- Integration with a Dynatrace profile: Integrate your BlazeMeter tests with a specific Dynatrace profile to send requests to your monitored servers. The associated monitoring KPIs become available in your Dynatrace application. A Dynatrace profile also enables AI root cause analysis.
These integration options empower you to effectively monitor and optimize the performance of your applications, ensuring a seamless user experience.
BlazeMeter includes two versions of the Dynatrace APM integration:
- Dynatrace APM - deprecated
- Dynatrace APM
Because Dynatrace has deprecated their v1 APIs with Dynatrace version 1.243, and replaced them with v2 APIs, we have created a new Dynatrace integration to accommodate this change.
- If you are using a Dynatrace version that is 1.243 or higher, use the Dynatrace APM integration.
- If you are using a Dynatrace version that is lower than 1.243, use the Dynatrace APM – deprecated integration.
For more information, see https://www.dynatrace.com/support/help/dynatrace-api/basics/deprecation-migration-guides
- Set up Dynatrace to work with BlazeMeter
- Create an Anonymous Integration
- Integrate BlazeMeter with your DynaTrace Profiles
- Use Dynatrace APM for AI-driven root cause analysis
- View DynaTrace metrics in your Timeline Report
Set up Dynatrace to work with BlazeMeter
You can leverage Dynatrace metrics within BlazeMeter reports and send distributed tracing data from BlazeMeter to Dynatrace via headers. This section outlines the necessary setup steps within Dynatrace to facilitate this integration.
- Pulling Metric Values into BlazeMeter Reports—To pull metric values from Dynatrace into BlazeMeter reports, you can utilize BlazeMeter Profiles.
- Sending Distributed Tracing Data—BlazeMeter can send distributed tracing data to Dynatrace via headers, enabling you to trace a request's path through its journey across various components such as apps, rpc (Remote Procedure Call), queue, and more.
BlazeMeter adds a customer header to requests that are run through JMeter performance tests. This header includes the Sample Name, Number of VUs, and Load Locations for each request. This allows for distributed tracing of the request from source to end point.
To view the headers sent from BlazeMeter to Dynatrace and facilitate distributed tracing, perform the following steps in Dynatrace:
- Create a new request attribute.
- Within the request attribute settings, add a new data source.
- Set the request attribute source to HTTP Header Request.
- Define the parameter name as
x-dynaTrace. - Set Preprocess parameters by extracting substring to after and NA.
For more information, see Dynatrace Documentation.
Create an anonymous integration
This integration involves inserting header lines into your JMeter file, visible exclusively from the Dynatrace APM perspective. You can use this integration for a new or existing performance test.
No reports will be generated on the BlazeMeter side through your Dynatrace account.
entities.read, events.read, metrics.read, and metrics.ingest. For information about how to configure token scopes, see the Dynatrace documentation.- Navigate to the BlazeMeter Test Configuration page.
- In the APM integrations section, click Dynatrace APM (or Dynamic APM - deprecated).
- Select the Integrate using Dynatrace HTTP headers option.
- Run the test.
When you execute this test, BlazeMeter appends a header line to the JMX of the test. This action enables Dynatrace's agent to identify the load test and display BlazeMeter's requests in a specific format, featuring request labels, thread numbers, response codes, and more.
- Access these results within Dynatrace. For more information, see the Dynatrace documentation.
Integrate BlazeMeter with your DynaTrace profiles
This integration enables you to access APM metrics from both the Dynatrace APM and BlazeMeter sides, depending on your profile setup.
You can use this integration for a new or an existing performance test.
- Navigate to the BlazeMeter Test Configuration page.
- In the APM Integrations section, click Dynatrace APM (or Dynamic APM - deprecated).
- Select the Integrate using specific Dynatrace system profile option.
- In BlazeMeter, select the Dynatrace system profile to use. You can also manage an existing profile by clicking the corresponding modify, duplicate, or delete icon.
-
If you do not have a profile, create credentials by entering the required key details. You can locate the Environment ID and Token values in the Dynatrace documentation.
Basic Configuration:
- Key Name — Name of the key you want to create and reference in BlazeMeter
- Environment ID — The full URL containing your environment ID (Exclude the trailing / in your URL, for example, http://yourHostAtDynatrace.com).
- Token — Access token for your DynaTrace environment
Advanced Configuration:
- Private Location ID — The ID of the private location to run the APM functionality. To learn more, see Find the harbor ID and ship ID.
If you're using DynaTrace in the cloud, you don't need to provide the private location ID. The integration works seamlessly without it.
-
Specify your entity type, Dynatrace entity, and the metrics to include in your BlazeMeter report.
Use the search/autocomplete functionality in the Entry field after selecting an Entry Type (such as Hosts, Process, Application, or Services) to quickly find the desired entry. - Click Next to review a preview of what your profile will monitor.
- Enter a Profile name and save the profile for future tests.
- Select the profile to use for the test.
- Click Apply.
Your test is now integrated with DynaTrace.
Use Dynatrace APM for AI-driven root cause analysis
To use AI Anomaly Analysis for your tests, you need to enable AI features. For more information, see Manage AI consent.
APM Correlations connect anomalies detected during a performance test with related metrics from Dynatrace APM. The correlations provide additional context about the application components affected by an anomaly and can help you investigate the likely source of a performance issue.
You can connect a Dynatrace APM profile to a performance test to add APM data to the insights displayed in the Analyze and address anomalies with AI Anomaly Analysis tab.
- Navigate to the BlazeMeter Test Configuration page.
- In the APM integrations for root cause analysis section, click Dynatrace APM.
- Configure the Kubernetes label pairs used to identify the workload or service whose Dynatrace data should be associated with the test.
- Enter label names and values that match the labels assigned to the corresponding Kubernetes resources.
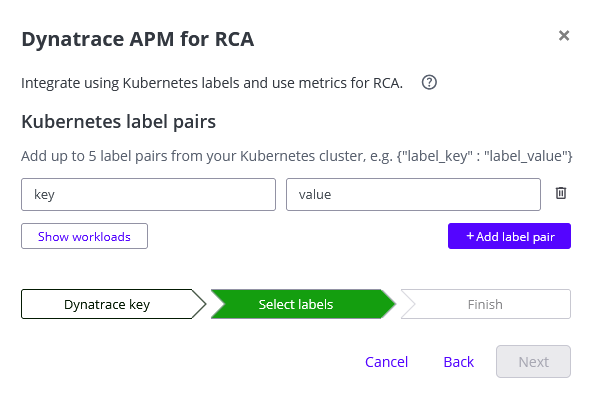
- Add each required label pair separately.
- Save the test configuration.
- Run the test.
- Open the AI Anomaly Analysis tab in the test results to view insights that include data from Dynatrace.
When a performance-test anomaly matches data from the connected Dynatrace profile, the AI-generated insight includes the correlated APM information. Use this information together with the anomaly explanation and recommendation to investigate the potential root cause.
Manage the Dynatrace APM profiles used for root cause analysis in Settings > Workspaces > APM profiles for RCA.
View DynaTrace metrics in your Timeline Report
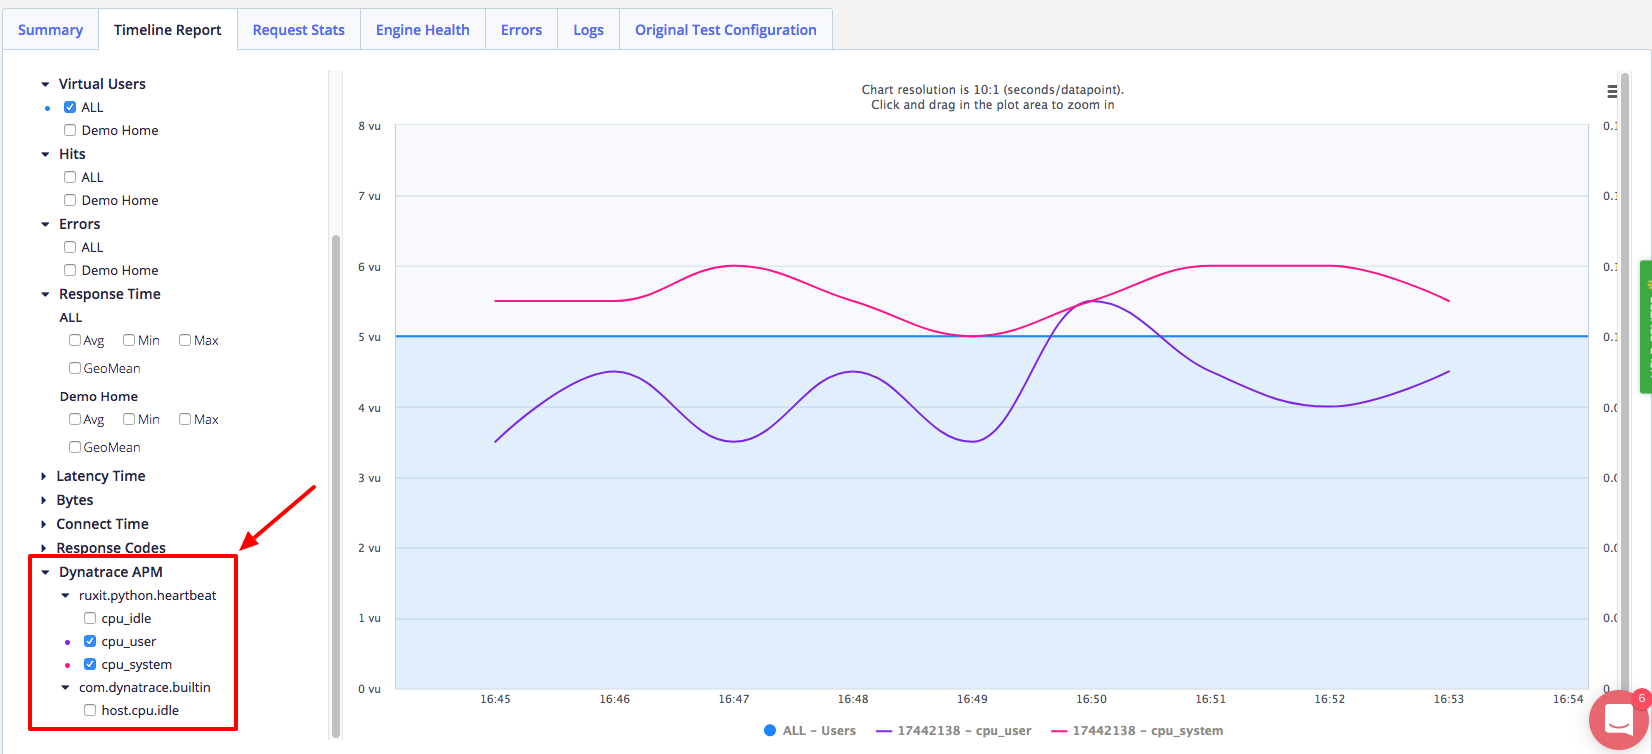
To view the metrics from Dynatrace, you can go to the Timeline Report, scroll to the bottom of the available KPIs, and then expand the Dynatrace APM section. You will then see all the metrics you selected listed there and can click the checkboxes to add them to your report, which you can see below: