BlazeMeter Jenkins plugin
BlazeMeter provides a plugin for executing automatic load test scripts in Jenkins, an open-source continuous integration tool. The plugin is named the "BlazeMeter Plugin" or "BlazeMeter's Jenkins Plugin".
This BlazeMeter-Jenkins plugin lets you load test your site with BlazeMeter and then to view and analyze the test report in Jenkins. It also allows you to set the final Build status as good, unstable or failed, based on the reported error percentage and response times KPIs.
- What is Jenkins?
- Install BlazeMeter plugin for Jenkins
- Configure BlazeMeter plugin for Jenkins
- Configure a job using BlazeMeter Jenkins plugin
- Set up the Build test
- Run a BlazeMeter test in Jenkins without a plugin
- Build a job with BlazeMeter Jenkins plugin
- Use BlazeMeter with Jenkins pipeline
- Reports
- Add notes to public report
- Add JMeter session properties to test session
- Jenkins Report
- Performance Trend Report
- Performance Report
- Comprehensive reporting dashboard
- Pass/Fail critieria
- Logging
- Working with Proxy server
What is Jenkins?
Jenkins is an open-source continuous integration tool written in Java for automating tests. Builds can be started in various ways. For example, they can be triggered by a commit in a version control system, scheduled via a cron-like mechanism, or built when other builds have completed, and by request of a specific build URL.
Install BlazeMeter plugin for Jenkins
You can also download BlazeMeter's Plugin to Jenkins, or install it through the Jenkins Dashboard:
- Log in to Jenkins and go to the dashboard. Select ‘Manage Jenkins’ and then ‘Manage Plugins’. Then, from the top tabs, select ‘Available’.
- Hit 'Ctrl + F' / ‘CMD +F’ in your browser and search for BlazeMeter. Then mark the BlazeMeter check box.
- Scroll down and click ‘Download now and install after restart’.
- After the download starts, click to restart Jenkins.
Configure BlazeMeter plugin for Jenkins
- After the restart, click 'Manage Jenkins' and then click Configure System.
- Scroll down to the 'BlazeMeter Cloud' section. You will see the URL 'https://a.blazemeter.com'.
- Click Save.
- Click Credentials > System > Global Credentials (unrestricted).
- Click the Add Credentials button and choose the BlazeMeter Credentials button. Add your BlazeMeter API Key Id and API Key Secret.
- Add a nickname for your key in the Description field.
- Leave the 'ID' field empty - it will be generated automatically once you save the credential.
- Click the Test BlazeMeter credentials button.
Configure a job using BlazeMeter Jenkins plugin
- Click on an existing job or create a new one, then press Configure.
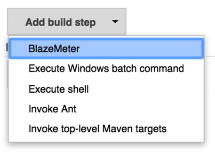
- Scroll down to the ‘Build’ steps. Click Add Build Step and choose BlazeMeter.
Set up the Build test
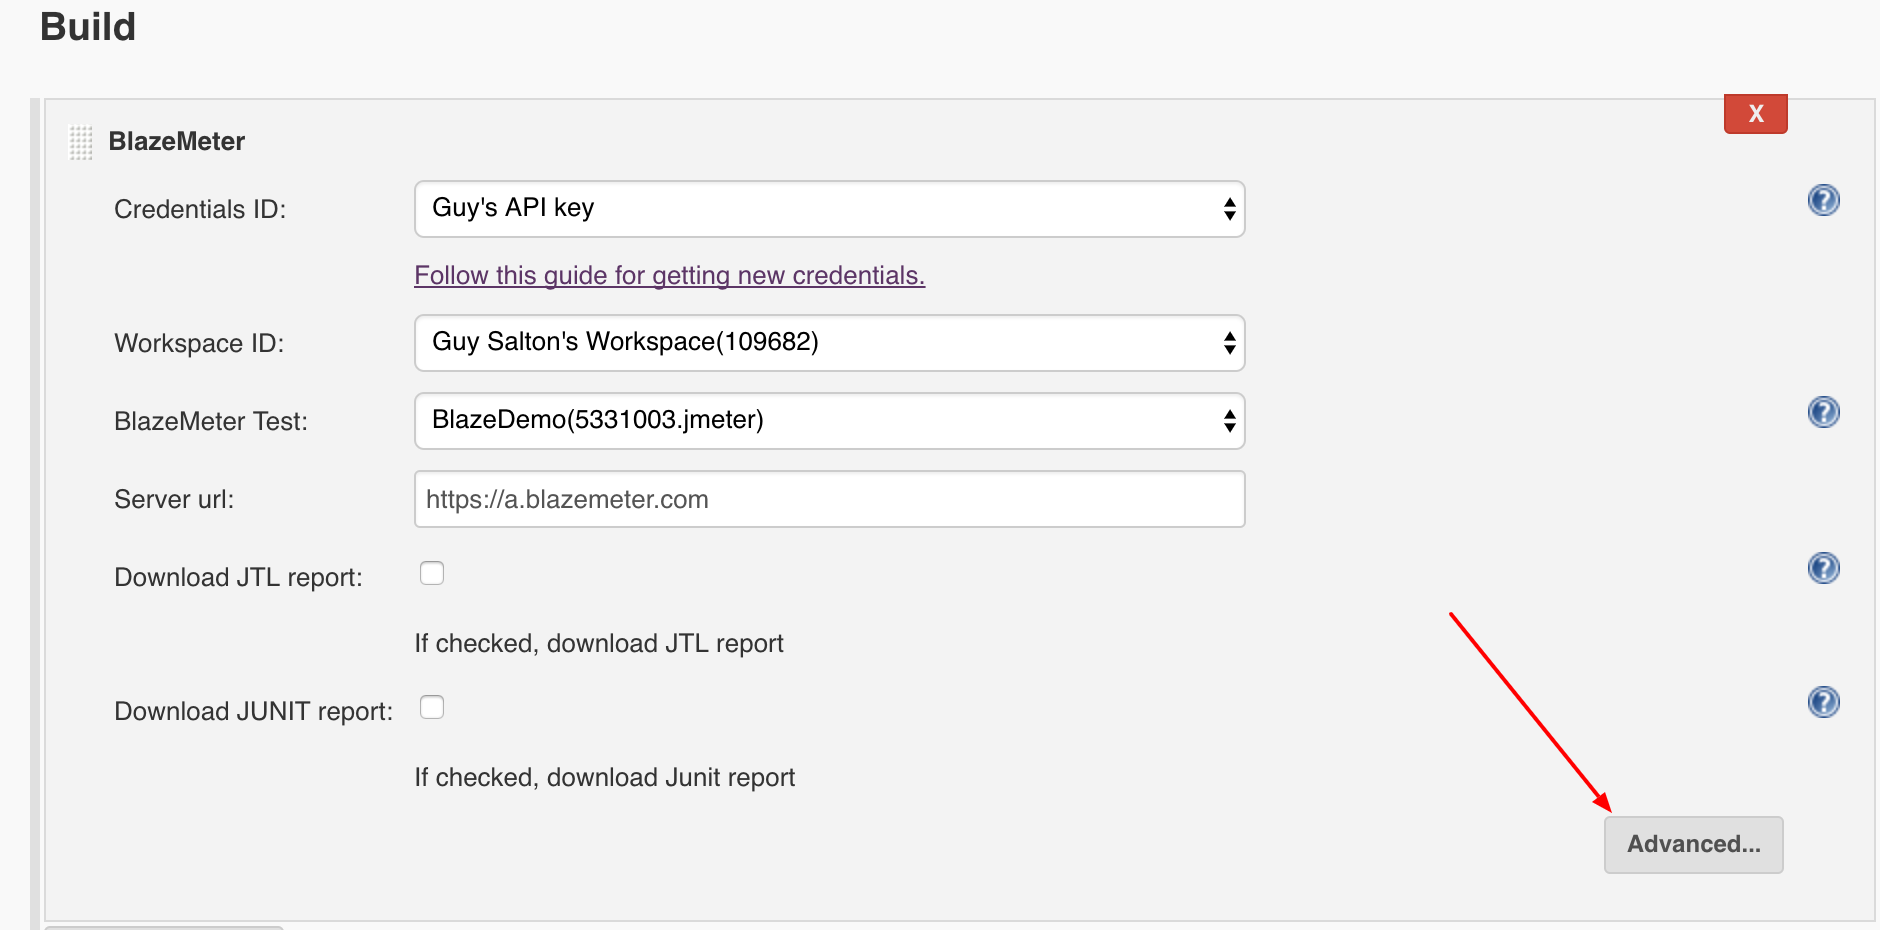
If your keys were pre-configured correctly in the global settings, you will see your Workspaces and tests in two drop down menus.
- Click the "Workspace ID" menu to choose the Workspace you want to see tests from.
You will now see all your tests for your chosen Workspace in the drop down menu 'BlazeMeter Test'. - Select a test to run.
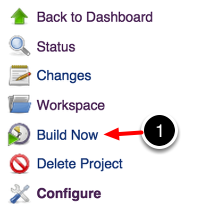
- Either click 'Save' to save your Jenkins project and then click 'Build Now' to run the test.
Or, use the plugin's additional configurations and only then save and build. There are a few options:- 'Download JTL report' checkbox - downloads the JTL report after finishing the test.
- 'Download JUnit report' - downloads the JUnit report after finishing the test.
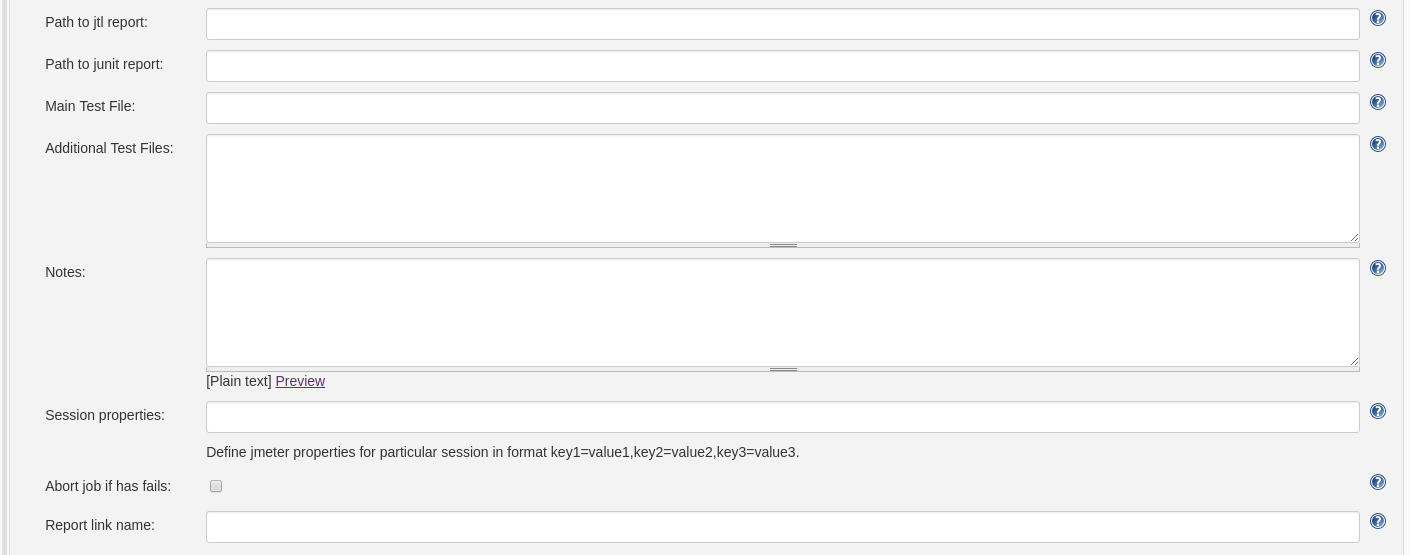
- 'Advanced' - options include the following properties:
- Path to the JTL and/or JUnit reports (if you checked the checkboxes)
- Path to the main and additional test files. This files will be upload in your BlazeMeter test (override if this files already exists) before run test. For more information, see the Setting Up Your CI/CD Pipeline With Jenkins and GitHub blog.
- Set Notes and JMeter properties for pushing to the BlazeMeter load test
- Interrupt FreeStyleProject build, if BlazeMeter Build Step was failed.
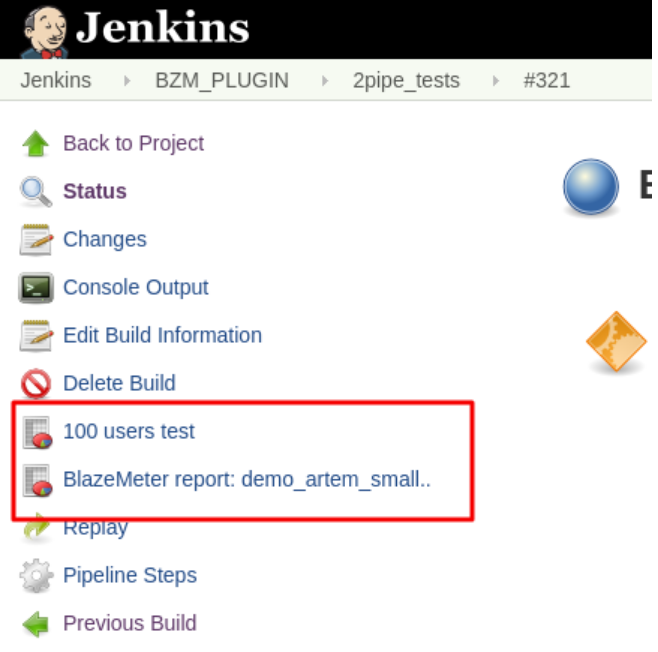
- Set custom report link name to BlazeMeter report in your Jenkins build
Reports
The plugin supports downloading two kinds of reports, JUnit and JTL.
All reports are saved to the ${WORKSPACE} by default, but this behavior can be overridden by defining paths. Paths can contain Jenkins variables, which are resolved to actual values.
When using the plugin with a master/agent Jenkins configuration, please keep in mind that, by default, the permissions that Jenkins has in the master filesystem differ from the agent permissions. For example, if you want to save jtl/junit artifacts outside of $JENKINS_DATA_FOLDER, set the permissions to 757 for the folder you want to use at master.
On the remote agent, the Jenkins agent has, by default, 777 permissions for the folder in /home. For example, if you're using ssh @ for connecting to the agent from master, then the Jenkins agent will have 777 permissions for /home/<username>.
Add notes to public report
You can add notes to the public report. This feature is available both in Freestyle projects and in pipeline mode.
- Open the job.
- Go to the BlazeMeter step.
- Expand the
Advancedsection. - Enter the note in the
Notesfield.
For more information, see the pipeline usage guide
The syntax notes:'a\n\b\n\t\r' produces a multiline note.
Add JMeter session properties to test session
There is an ability for adding jmeter properties to test session.
- Open the job configuration.
- Expand the
Advancedsection. - Enter session properties in the
Session propertiesfield in the following format:key=value,key1=value1,key2=value2
Snippet for using session properties with pipeline
Sending properties for the test session is currently not supported for multi tests.
Run a BlazeMeter test in Jenkins without a plugin
Jenkins, like any other CI tool, enables executing shell commands. With shell commands you can execute API calls to start tests, create tests, update them, etc.
Build a job with BlazeMeter Jenkins plugin
- Once inside the job, click 'Build Now'.
- Click the build that is running.
- Click 'Console Output' to see the build progress. You’ll see the test parameters and an update every few seconds.
- When the test finishes, you'll see a summary of the test results and their impact on the build.
You can now click ‘BlazeMeter Report’ to see the test report the same way you would see them on the BlazeMeter site.
You can also edit and compare test results to previous runs.
All logs and data generated during test runs are stored in a ZIP file which you can access directly from your BlazeMeter account, in the 'Logs' tab of the report.
Use BlazeMeter with Jenkins pipeline
For more information, see
https://github.com/Blazemeter/blazemeter-jenkins-plugin/blob/master/usingPipeline.md
Jenkins Reports
Jenkins Reports provide great out-of-the-box intelligence and visualization. Let's take a look at them:
Performance Trend Report
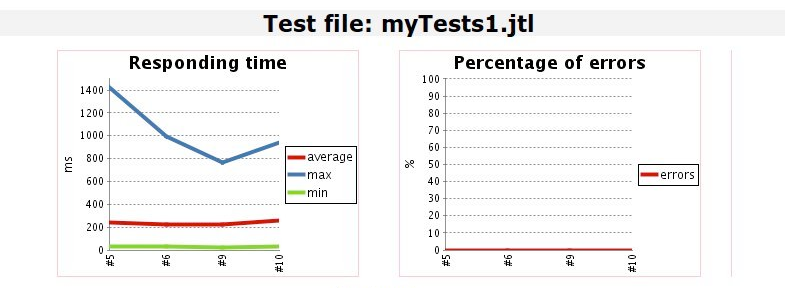
The Trend Report presents information about the trends and robustness of successful and failed test results, over time. This report is generated by fetching the JUnit.xml report when a test ends. This capability is inherent to Jenkins and is provided by the common Performance Jenkins plugin.
Performance Report
The Performance Report provides a basic KPI/Transactions report that visualizes a JTL that is an artifact of the test run. This report is built by fetching the JTL file when a test comes to an end.
Comprehensive reporting dashboard
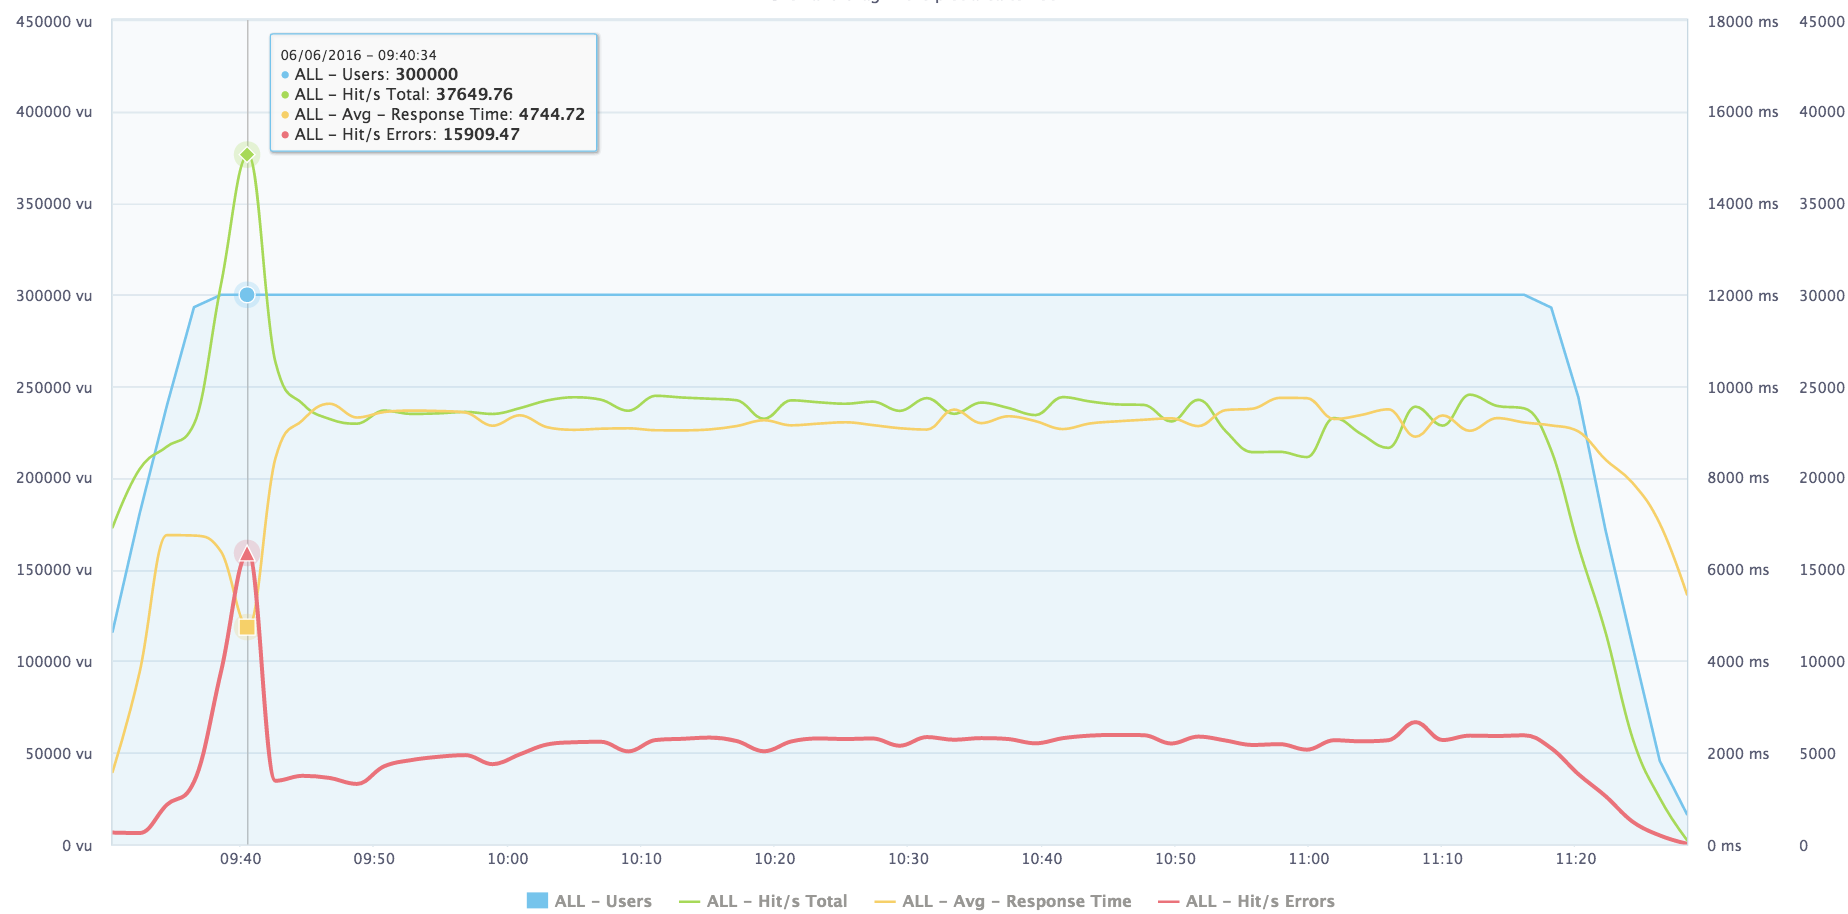
A far more comprehensive reporting dashboard is available during the test, and after the test has ended. By pressing the BlazeMeter link, the BlazeMeter reports are shown, providing a deep dive into the performance KPIs, helping you find performance bottlenecks.
PASS/FAIL criteria
The Plugin is using /ci-status requests for setting the build result. Depending on this request, the plugin sets one of the build results available in Jenkins:
SUCCESS - This status is set in the following cases:
- the test has no thresholds;
The test has thresholds and they were not violated;
There were no errors in the ci-status response.
UNSTABLE - The test was completed successfully, but there were errors in the /ci-status response;
FAILURE - This status is set in the following cases:
- The test has thresholds and they were violated;
- The test has no thresholds, but there were specific errors in the /ci-status response:
- "errors":[{"code": 70404,"message": "Session ended without load report data","details": null}]
- "errors":[{"code":0,"Message":"Not enough resources"}]
- The Jenkins job got an error on a /test/start request.
- The Jenkins job got an UNSTABLE status due to errors, for one of the possible reasons, which caused a FAILURE. FAILURE overrides UNSTABLE in all cases.
The default behavior in cases where a request to BlazeMeter does not respond or fail is to set job status to FAILURE. But you can change this status to UNSTABLE under the 'Manage Jenkins' -> 'Configure System' -> 'BlazeMeter Cloud' section using the checkbox 'Mark build as UNSTABLE if BlazeMeter does not respond with pass or fail.'
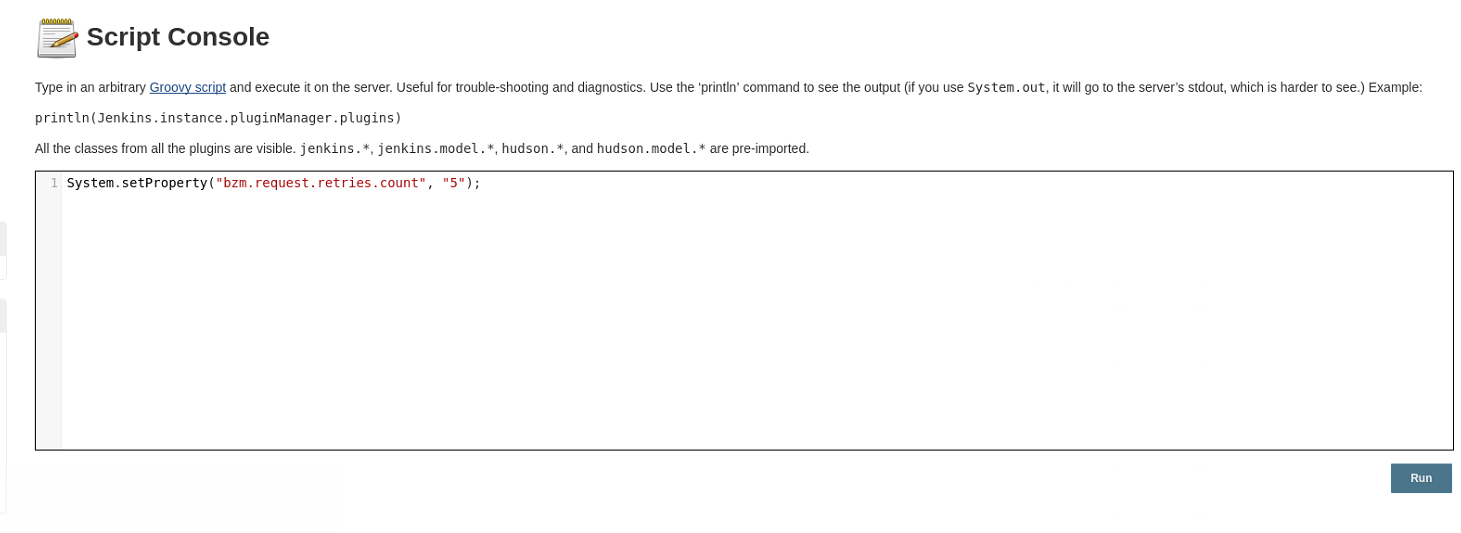
The other way to make your build more stable is to set the number of request attempts that the plugin will do in BlazeMeter. By default, this value is 3 (plugin will repeat the GET request to BlazeMeter if a response returned a failure, or BlazeMeter didn’t respond in time). You can configure the number of request attempts using Java System properties:
Go to 'Manager Jenkins' -> 'Script Console' and set the property 'bzm.request.retries.count' using the command 'System.setProperty("bzm.request.retries.count", "5");'
Logging
This Plugin comes with a <bzm-log> file which can simplify the debugging process in case of any issues with the running test.
This file is kept in the workspace. Its location differs depending on which kind of build (Freestyle job, or pipeline) is run.
If you run a Freestyle job, then you can use the following URL:http://<jenkins-host>/job/<job-name>/ws/<build-number>/
In case of pipeline, do the following to find your log files:
- Go to
http://<jenkins-host>/job/<job-name>/<build-number>/flowGraphTable/ - In the
Steptable, clickAllocate node:Start. - Change to
Workspaceand go into thebuild-numberfolder.
Work with Proxy server
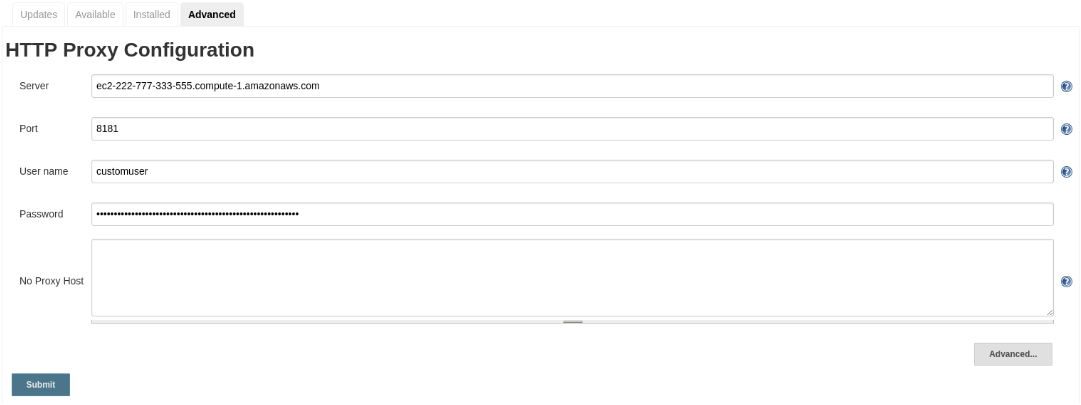
Since version 4.2, the Setup Proxy configuration for master and all agents are in the section
‘Manage Jenkins’ > ‘Manage Plugins’ > ‘Advanced’
This config is applied for each of the agents and master nodes.
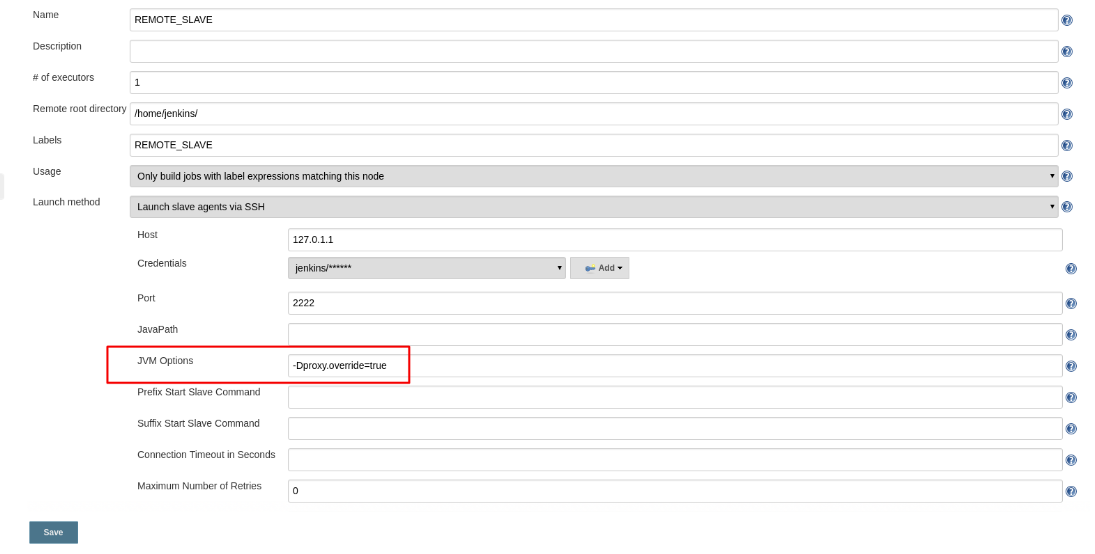
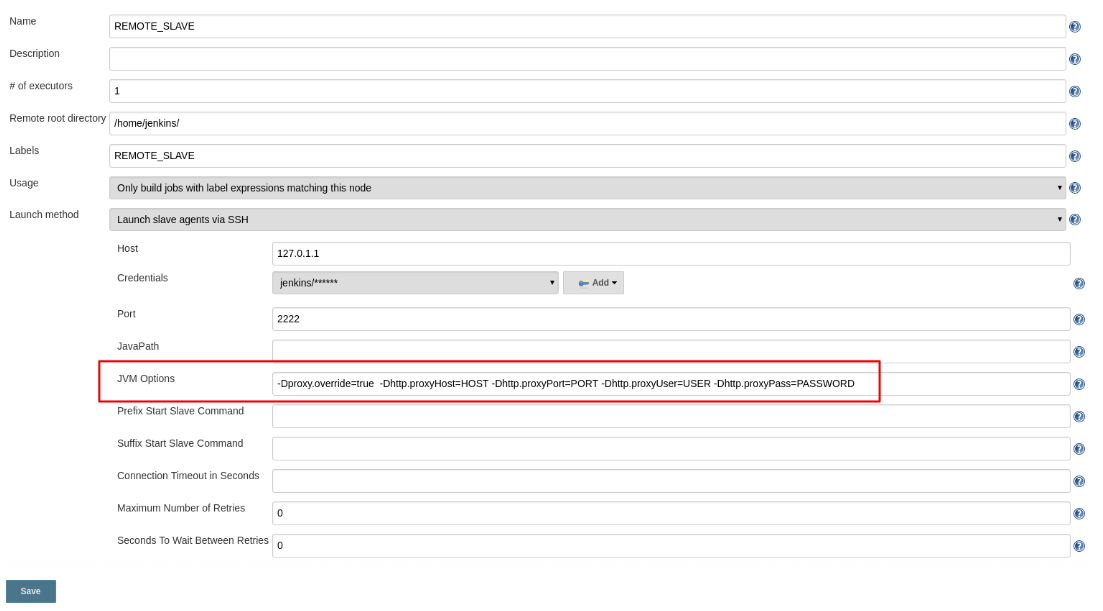
In case that you need to use some agent with a different Proxy server, or without it, you should add JVM params to this agent in the section
‘Manage Jenkins’ > ‘Manage Nodes’ > ‘Select Node’ > ‘Configure’ > ‘Launch method’ > ‘Advanced’ >’JVM Options’.
The argument -Dproxy.override=true means that this agent will use a different proxy configuration.
If this agent doesn’t use a proxy server, simply pass this argument below:
If you want to use a different proxy server, add the following options after the 'proxy.override' option:
-Dhttp.proxyHost=<IP>
-Dhttp.proxyPort=<PORT>
-Dhttp.proxyUser=<USER>
-Dhttp.proxyPass=<PASSWORD>
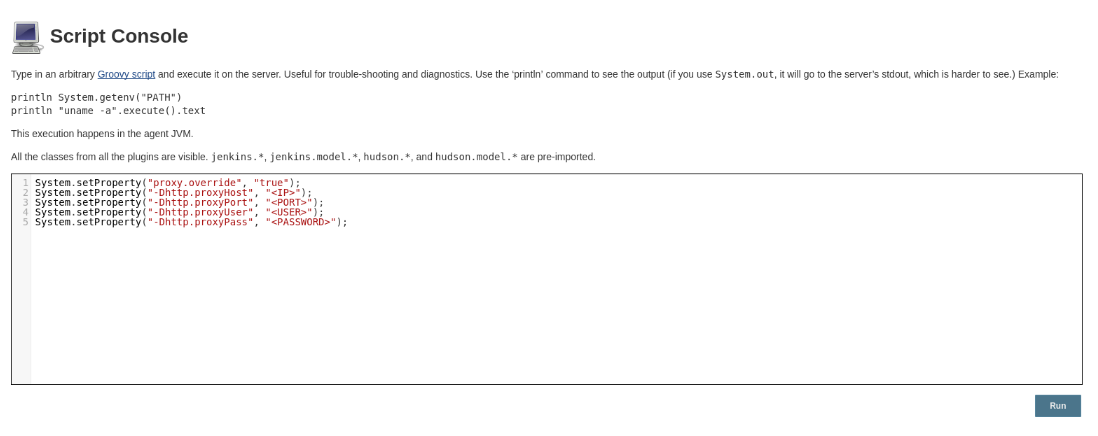
The other way for passing these Java properties to the agent without restart, is by using the Script Console, as described below,
System.setProperty("proxy.override", "true");
System.setProperty("-Dhttp.proxyHost", "<IP>");
System.setProperty("-Dhttp.proxyPort", "<PORT>");
System.setProperty("-Dhttp.proxyUser", "<USER>");
System.setProperty("-Dhttp.proxyPass", "<PASSWORD>");
Set Custom report link name
Since version 4.2, you can set a custom link name for the link to your BlazeMeter report:
By default, the Max report link name length is 35, but you can increase this value using the Java System property or Jenkins environment variable "bzm.reportLinkName.length".
Using Job DSL - https://github.com/jenkinsci/blazemeter-plugin/wiki/Using-Job-DSL
Using BlazeMeter Jenkins plugin with Github - https://www.blazemeter.com/blog/cicd-pipeline-jenkins-github
Learn more about JMeter + Jenkins Integration: Two Approaches.
Start performance testing now with BlazeMeter. Request a demo to learn more.


