Integrate with New Relic infrastructure
Learn how to set up a New Relic infrastructure monitoring integration with your BlazeMeter performance tests.
Prerequisites
-
You have a New Relic account.
-
You are familiar with New Relic infrastructure performance monitoring.
-
You have generated a API Query key in New Relic.
-
You have configured one or more infrastructure systems (entities) in New Relic.
For more information, see the New Relic documentation.
Steps
-
Log in to your New Relic account and copy your New Relic REST API key.
-
Log in to BlazeMeter and do one of the following:
-
Click Create Test and scroll down to the Integrations section.
-
Open an existing performance test, click the Configurations tab, and scroll down to the Integrations section.
-
-
Click New Relic Infrastructure.
-
If you do not have an existing New Relic API key, select Create a New Relic API Key and enter:
-
Profile Name — Enter a unique name for your New Relic API key
-
Account ID — Enter an account ID. Must be numeric digits
-
New Relic User API key — Enter your New Relic API key
-
-
Click Next.
-
Under Build profile, select Infrastructure.
-
Click Next.
- Select the required entities. The key performance indicators appear automatically according to your New Relic application profile settings.
-
Click Next.
-
Enter a profile name, and click Save Profile. A profile is basically a preset that is kept for your following tests, so you do not have to choose all the different metrics every time you run a test.
-
Click Apply
Result
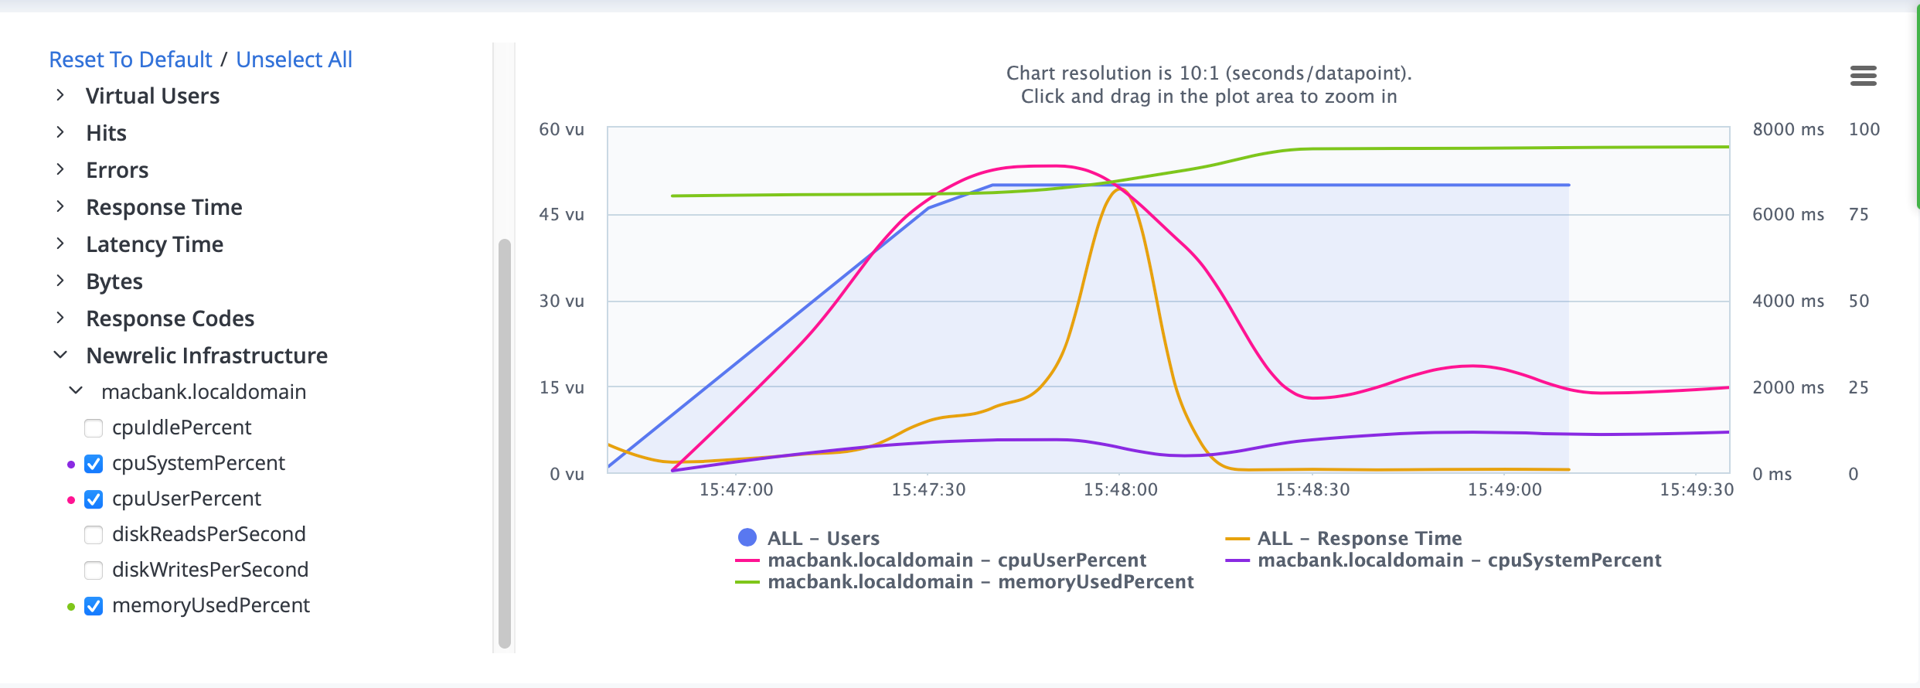
Your infrastructure monitoring data will appear in the BlazeMeter Timeline Report as soon as you run your load test. You can now diagnose performance-related problems, apply fixes and start the cycle all over again.