View analytics for transaction virtual services
To better understand usage and behavior of a particular virtual service and to troubleshoot performance or matching issues, use virtual service analytics for access to reporting, inspection and tracking data.
- View analytics for transactional virtual services
- See details in the inspection view
- Create transactions from a live service
- Get quick access to analytics
- View virtual services reports
- View usage metrics in settings
View analytics for transactional virtual services
- Navigate to the Service virtualization tab and click the Analytics tab.
- Click the Open + button and select a virtual service.
The Analytics page with the Inspection tab opens and shows requests that hit the virtual service and whether any transactions matched the requests.To view other virtual services, click Open + repeatedly. A new tab will open for each virtual service. - Navigate to the Inspection tab.
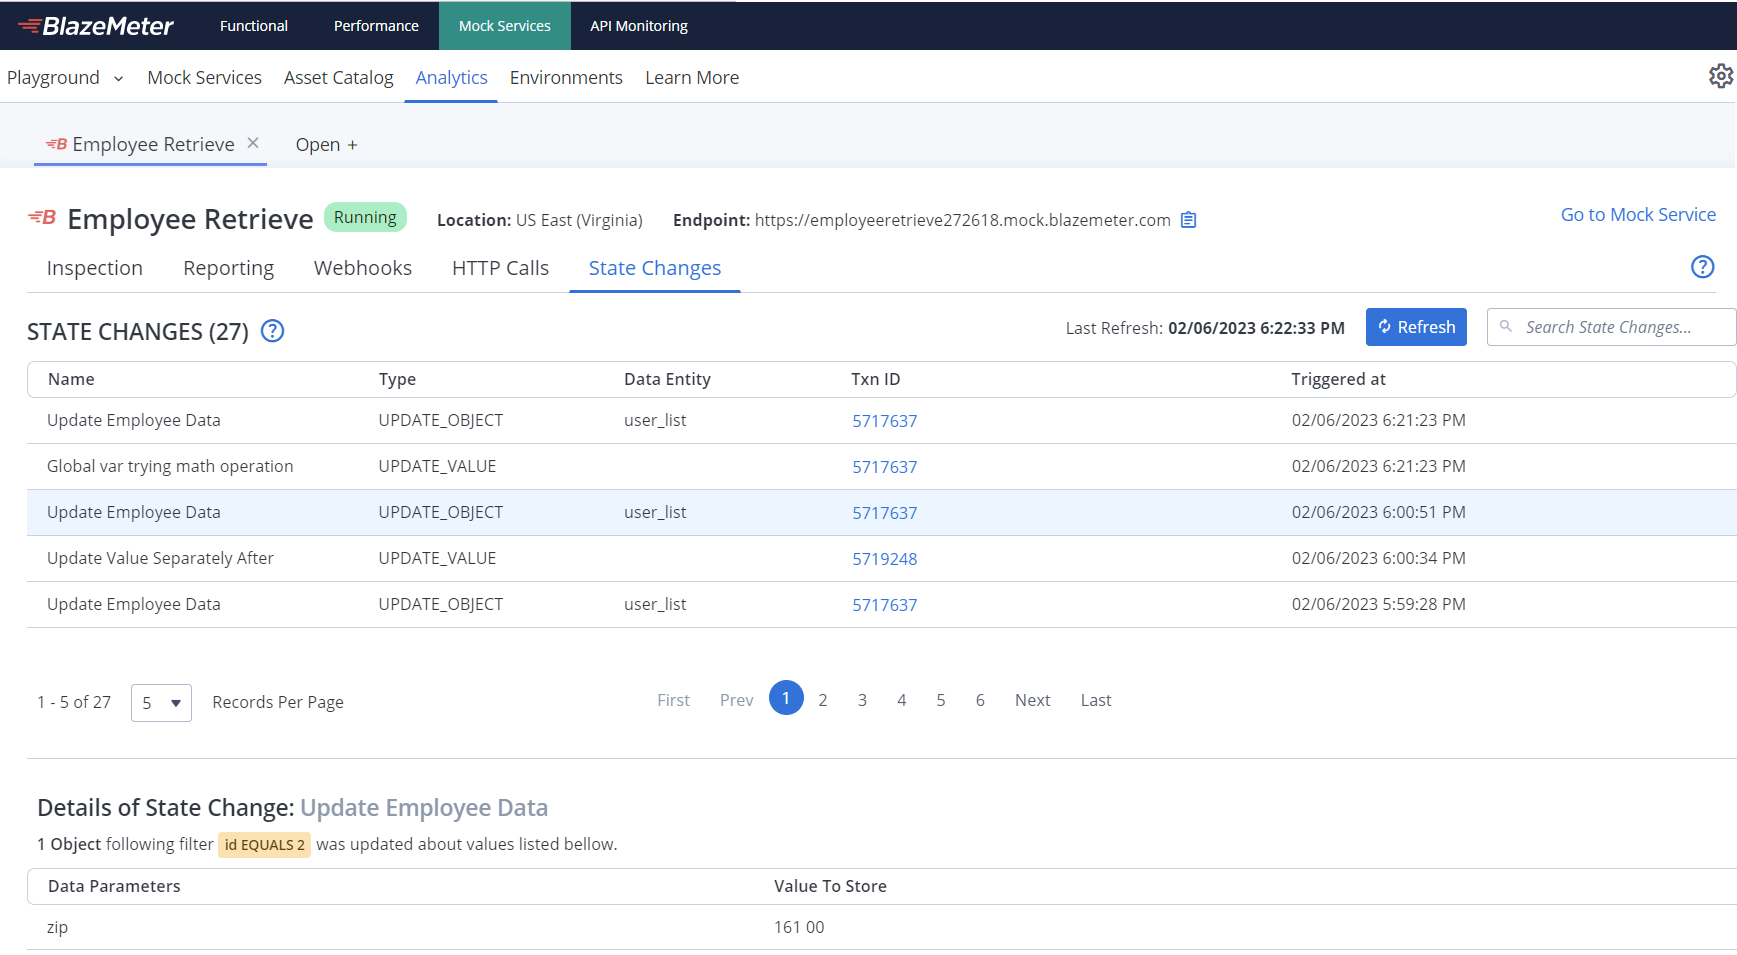
You can view matched and not matched requests and their responses as well as the traffic inside the virtual service.
See details in the inspection view
Inspection view displays details about recent traffic handled by a specific virtual service. Understanding which requests and responses were handled by your virtual services is critical in cases when there is a need to debug why certain requests were or were not returned by a virtual service. You can quickly identify specific requests by full-text search and display corresponding response details.
The Inspection view registers up to 5 requests per second, and 50 actions per second, per virtual service.
All actions share the same storage and are limited to 100. If there are more, the oldest are not visible. This means:
-
The maximum total requests visible in the inspection view is 100.
-
The maximum total actions visible in the inspection view is 100.
This limit of 100 includes all types of actions, so it might show you "34 HTTP calls + 33 webhooks + 33 state updates" or "100 HTTP calls", depending on which actions are executed by your transactions.
The value shown on the main page is the total transaction count from the time on when the virtual service was created; this total is not reset by a restart.
Get one-click access to the matched transaction from inspection view
If network traffic was matched by your virtual service, it is important to know which transaction was responsible for that match. To review the matching rules, click the transaction ID. The transaction definition pop-up dialog opens. 
Create transactions from a live service
Inspection view allows you to directly create transactions based on the real responses provided by the live system in case the virtual service is in Redirect to live system mode.
- Navigate to the Service virtualization tab and click the Analytics tab.
- In the Inspection tab, you can see the type of service in the Source column - mock or live.

- Create a new transaction from the live service. Hover over the Live tag in the Source column and click the display icon that appears.

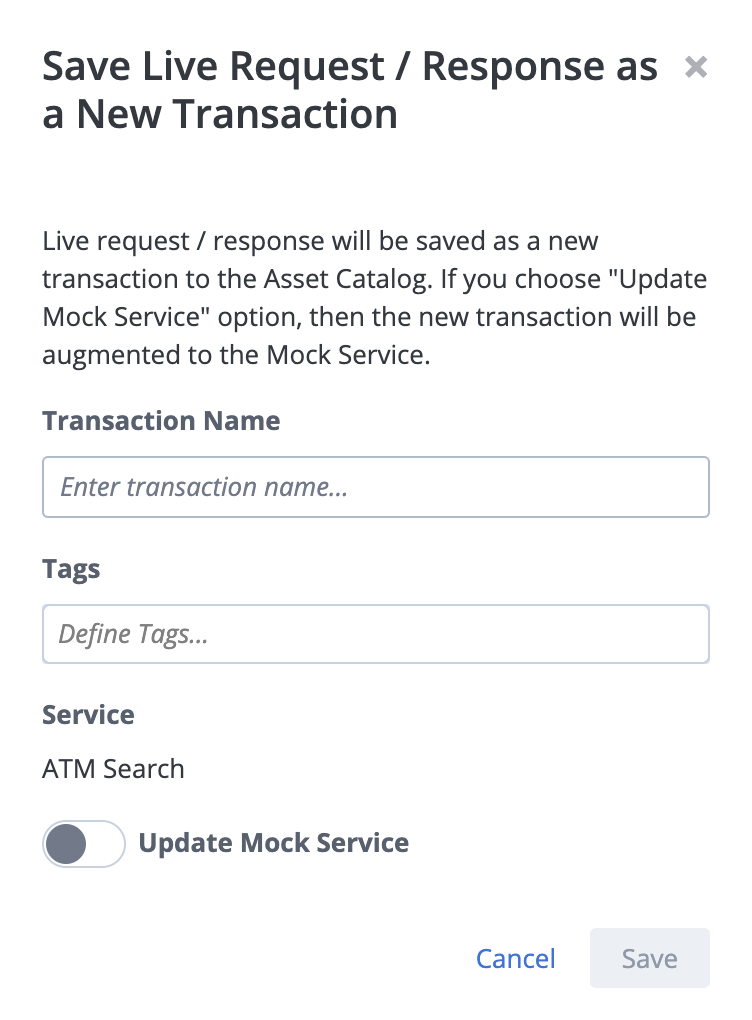
- A window Save live request / response as a new transaction opens.

- Enter the transaction Name.
- (Optional) Assign tags.
- (Optional) Enable Update virtual service to update your virtual service with a newly created transaction.
The transaction is created. You can view it in Asset catalog.
Get quick access to analytics
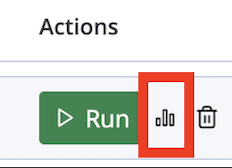
When hovering over a row in the virtual services table, a bar chart icon appears next to the virtual service entry. Click this quick access button to open the Analytics tab directly to view reports for this virtual service.

View virtual services reports
For every virtual service, it is possible to display four different reports to analyze the utilization and behavior of the service.
- Transaction daily counts
- Transaction hits and misses
- Virtual service response time
- Virtual service transactions per second
Follow these steps:
- Navigate to the Service virtualization tab and click the Analytics tab. For detailed steps, see View analytics for a transaction virtual service.
- Select the Reporting tab.
- Select a report from the drop-down list.
- Select a time range of data in which you are interested in. You can select an explicit range or use the presets.
Transaction daily counts
The transaction daily counts report displays the number of transactions in a defined time period for a selected virtual service. This report allows you to review your system loads by virtual service.
Transaction hits and misses
The transaction hits and misses report displays the number of transactions that were performed on virtual services for a given time period.
The report displays a bar chart with the total number of the following types of transactions:
- Node hits
A node hit occurs when the node matches a meta or signature response in a service image. - Specific Hits
A specific hit occurs when the request matches a specific transaction. - Misses
A miss occurs when the request is unknown and the request does not match a signature or exact match.
The data in this report is limited to a single virtual service. Click an item in the legend at the bottom of the report to hide or show the corresponding data. For example, click Misses to hide that data in the graph. When data is hidden, the legend item turns gray.
Virtual service response time
The virtual service response time report establishes the current health of a specific virtual service. This report is useful for determining how different system loads or performance testing impacts the response times for a virtual service.
Response times in this report include think time. This means that each response time includes the amount of time required to process the request and the specified think time.
The report displays the maximum, average, and minimum response times, in milliseconds, in the form of a line graph.
Virtual service transactions per second
The virtual service transactions per Second report establishes the current health of a specific virtual service. This report is useful for determining how different system loads or performance testing impacts the transactions per second for a virtual service.
The report displays the displays the maximum, average, and minimum transactions per second in the form of a line graph.
For virtual service response time and virtual service transactions per second reports, the following applies:
- For reports of range up to 6 hours, granularity of one minute is used.
- For reports of range up to 168 hours, granularity of one hour is used.
- For reports of range higher than 168 hours, granularity of one day is used.
View usage metrics in settings
The usage report tab under settings is only available to administrators and is typically used for licensing/cost analysis. To learn more, see View usage reports.
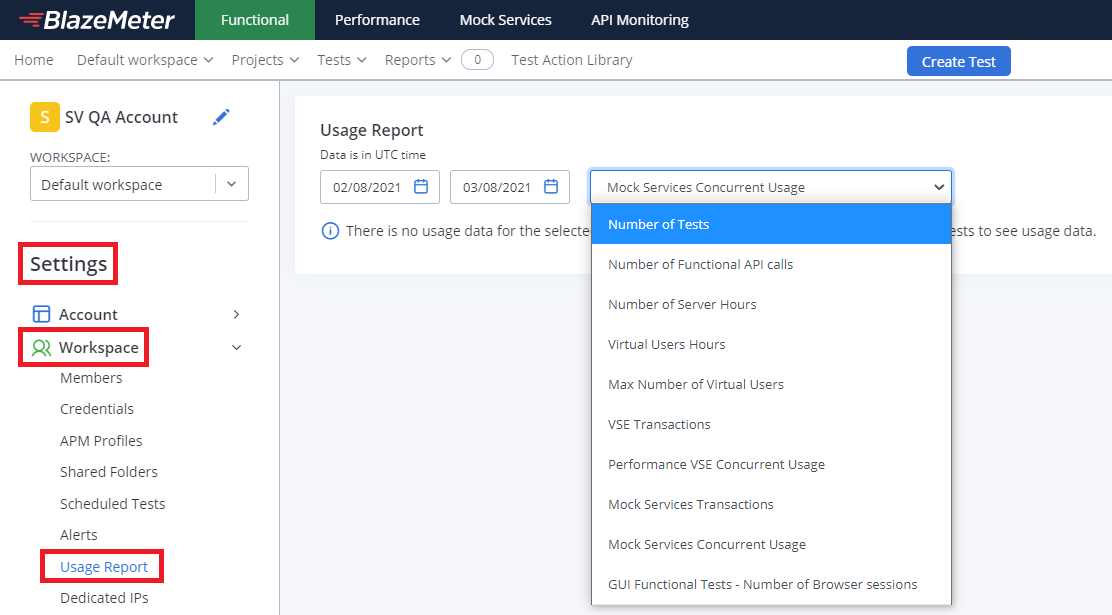
- Navigate to Settings, Workspace, Usage report.
- In the Usage report section, open the drop-down list to view the metrics for this workspace or account, respectively.
- The Virtual services transactions report shows the number of transactions for transactional virtual services by time range.
- The Virtual services concurrent usage report shows the maximum number of virtual service replicas for transactional virtual services concurrently running for this workspace or account, respectively.

