Comparing reports
You can compare test reports to each other and examine any differences in reported results. In BlazeMeter, test reports for two different tests or two executions of the same test can be compared.
Set up the comparison
Follow these steps:
- Open one of the reports that you want to compare and click the button to the right of the test report name to open a sub-menu.
-
Click the Compare Report option.
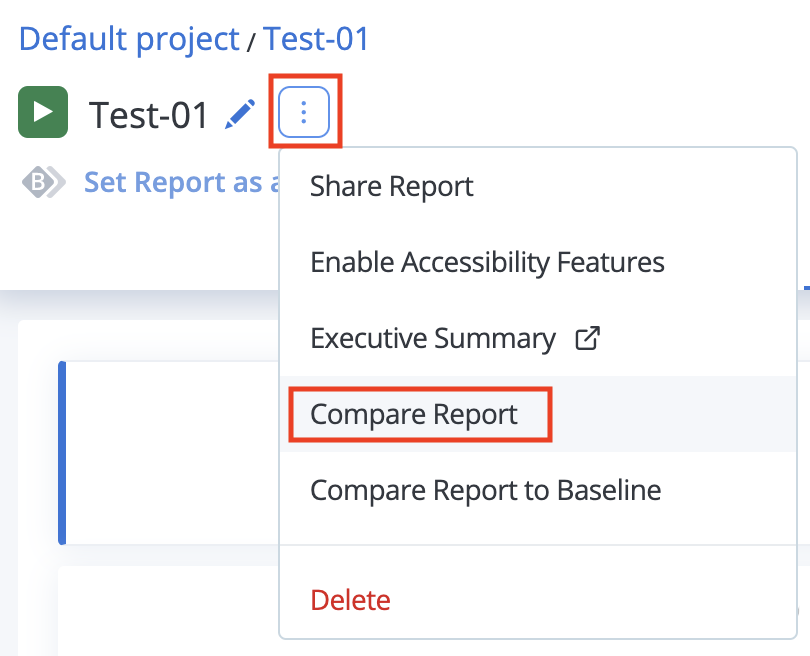 You can also compare a report to a baseline. For more information, see Baseline Comparison.
The Add Test Runs to Compare prompt window appears with the selected report.
-
Select the project, the test and the test runs to compare.
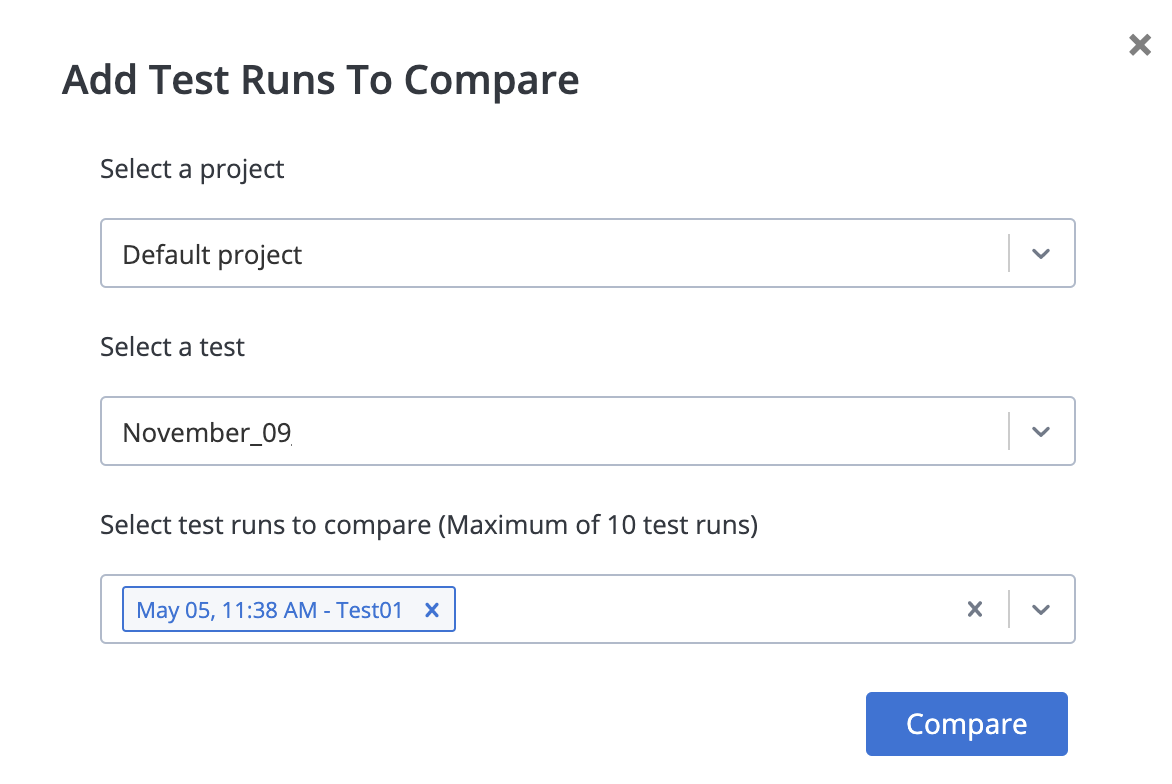 You can compare up to 10 test runs. Each time a new test report is added for tests that share a common name, all of the previous selected tests will appear in the Select test runs to compare field.
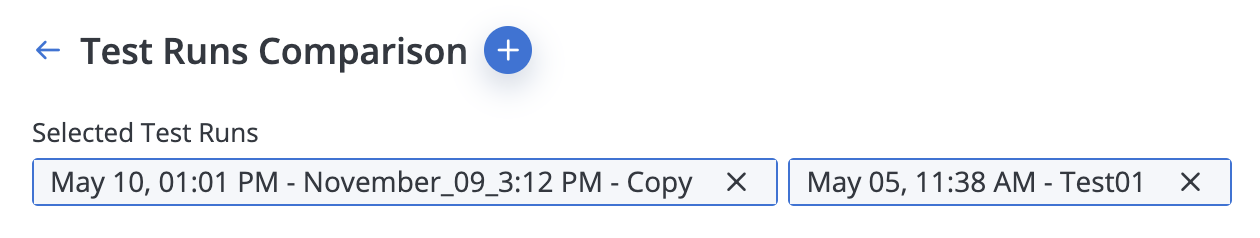
 - Click Compare.
You will be taken back to the Test Runs Comparison view, where you can see both tests:
The view will immediately populate with data from both reports, each represented by a different color line in each graph.
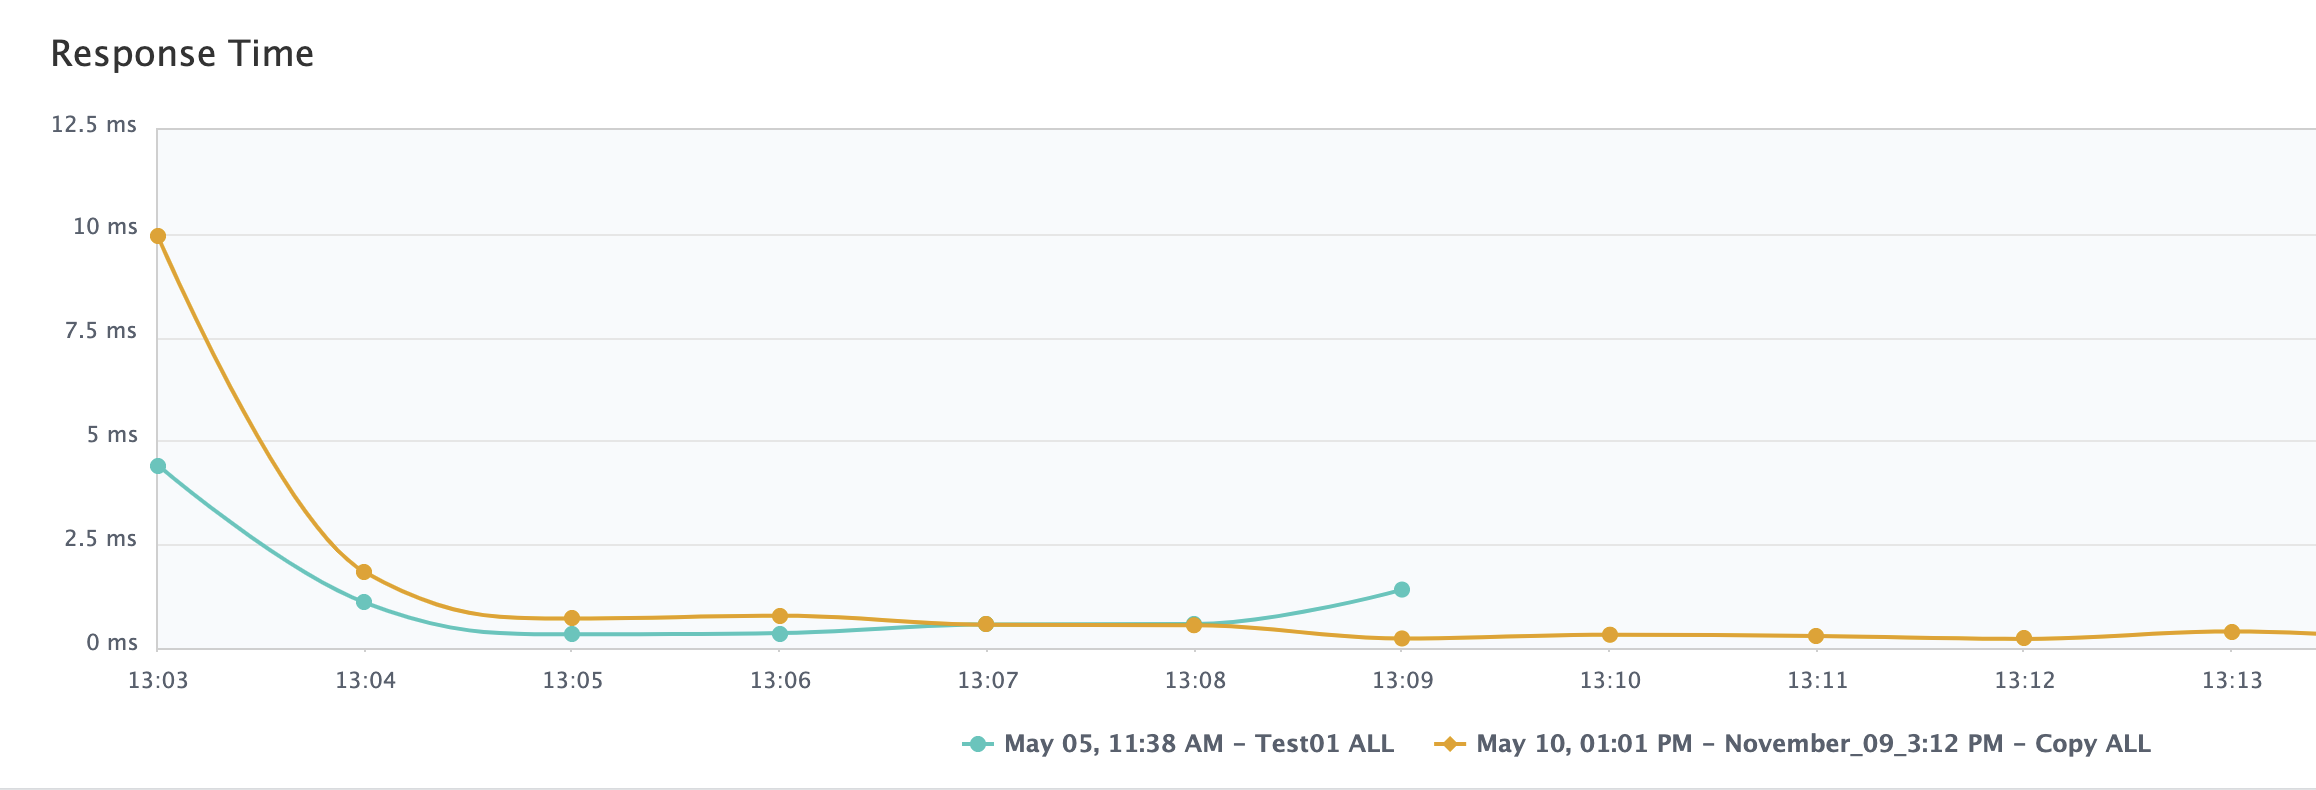
You can see graphs for Response time, users, latency, bandwidth, hits per second, errors per second and 90th percentile.
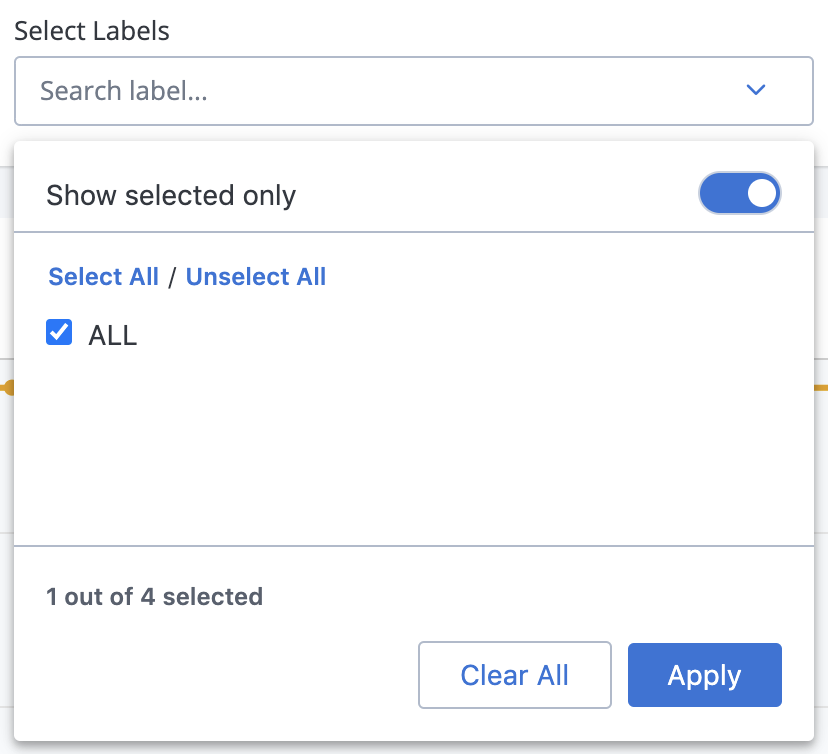
Filter by labels
If you want finer control over what report data is included in the comparison, you can use the Select Labels drop-down list to filter results based on the label names that you included in your test script. The default selection is ALL, meaning all labels or all report data.
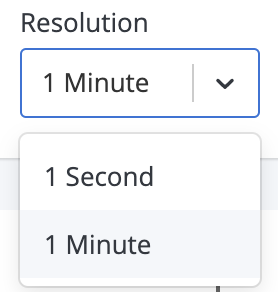
Adjust resolution
You have the option to configure the graphs to measure by minutes or seconds using the Resolution drop-down menu:
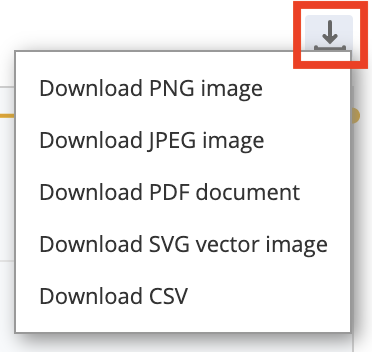
Export graphs
You can export each graph individually to one of several formats by clicking the arrow icon in the top-right corner of the graph:
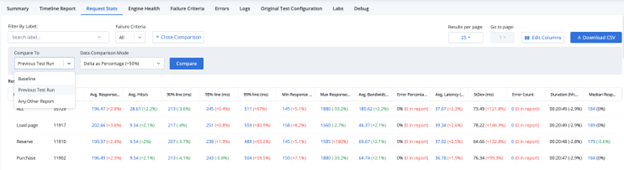
Compare Request Stats reports
You can generate a Request Stats comparison report in a tabular format to read and identify any deviations. This report can help you determine if there is any degradation in performance and pinpoint the specific endpoints affected.
This feature is available for both single tests and multi-tests. You can compare a Request Stats report to the baseline, the previous test run, or any other report. The compared report values appear in parentheses:
-
Green: Greater than the original report.
-
Red: Less than the original report.
-
Black: Equal to the original report.
Steps
-
Open the required report and click Request Stats.
-
Click Compare.
-
To select a test for comparison, in the Compare To list, click one of the following options:
-
Baseline (if a baseline report exists)
-
Previous Test Run (if this test has run before)
-
Any Other Report
When selected, the following lists display:
-
Select a Project. Click the required project.
-
Select a Test. Click the required test.
-
Select a Test Run to Compare. Click the required run of the selected test.
-
-
-
In the Data Comparison Mode list, click one of the following options:
-
Delta as Percentage (+50%) – This option shows the difference between the compared values as a percentage.
-
Actual Values (300ms) – This option displays the actual measured values for the metrics being compared.
-
Delta in Actual Units (+50ms) - This option shows the difference between the compared values in the actual units used.
-
-
Click Compare. The values of the compared report appear in the table in parentheses.
-
When you have finished comparing reports, click Close Configuration.