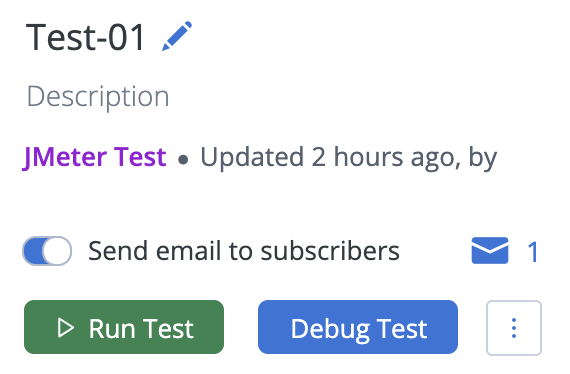
Debug test: Low-scale test run and enhanced logging
The Debug Test feature lets you validate your test configuration by creating a logical copy of your test and running it at a low-scale. The test will run with 10 threads and for a maximum of 5 minutes or 100 iterations, whichever occurs first. Any test initiated by clicking the Debug Test button is considered as free and will not charge a credit or VUH (Variable Unit Hour) for the test run.
Run a Debug test
The data for Debug Test runs is deleted after 30 days.
Follow these steps:
- In Performance tab, click Tests.
- Select a test that you want to debug.
-
Click the Debug test button.

- Review the configuration and click Start Debug Run.
A low-scale test run is created. Use the test run to validate your configuration.
If you encounter the following error when starting a debug test, Bad Request: Multiple scenarios are not supported in Debug mode.
see Debug Tests Fails with "Multiple scenarios are not supported" for more details.
View results of Debug test runs
Follow these steps:
- Select a test.
- Navigate to the History tab of the test configuration.
-
Select the Debug toggle.
You will see your Debug Test runs in Reports:

View detailed request and response data
Detailed request and response information can be found in the trace.jtl file that is added to the artifacts.zip file for Debug Test runs.
The Debug Test runs do not appear in test trends, the Reports drop-down menu, or the Show All Reports lists. Also, they do not enforce or display a Passed/Failed status.