Logs report
The Logs report lets you view and monitor the logs of each engine used during the test run, ensuring full test transparency. You can display and filter engines and logs, and then select multiple logs for download.
When running a test with several engines, you can:
- Filter the list of engines (for example by status, scenario, results received, or execution errors) to focus your troubleshooting efforts on a specific area of the test.
- If you are looking for a specific text, view logs for selected engines (even while running).
- Select logs from multiple engines and download all of them at once.
View Logs report
Follow these steps:
- In the Performance tab, select Reports. The most recent reports are shown on top.
- Click Show all reports and select a report to view its details.
- Click the Logs tab.

Download multiple logs
Follow these steps:
- Log in to BlazeMeter and go to the Performance tab.
- Select a test.
A Summary of the test opens. - Click the Logs tab.
- Select one or more engines from the Load engines section. Each load engine generates its own logs and artifacts.
The Logs section opens on the right. - Expand the Engine ID to see the individual logs.
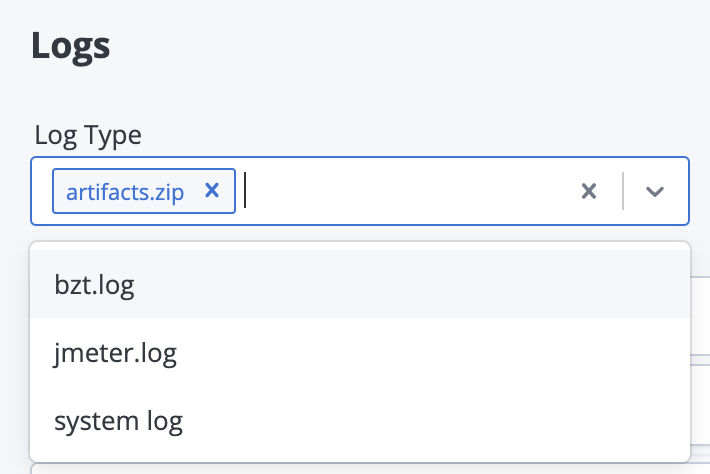
- (Optional) You can filter the logs by Log Type.

-
Select one or more logs and click the Download selected button.
You cannot download a System Log as part of a batch of other logs using the Download selected button. To download a System Log, see The System Log section.
A zip file with the selected logs is generated. You get a link (also via email) to the file that you can download directly or share with others.
If your tests are running on a private location, you can view the following information about the private location engine: the private location name, agent name, and a direct link to the private location configuration screen.
View the logs
Test artifacts

BlazeMeter engines run on Taurus. Taurus collects all test files in an artifacts directory on each engine, which BlazeMeter zips up at the end of each test run. Click the download icon to download it.
This ZIP file includes:
- The test script in your test configuration
This will either be a script you uploaded or a script BlazeMeter auto-generated in order to run your test. - A copy of the script that shows any modifications BlazeMeter made prior to running it.
The file name will have a modified_ prefix. - Various Taurus YAML files.
If you uploaded your own YAML configuration file, it will appear here, along with additional versions showing any modifications BlazeMeter made to it. If you did not upload a YAML, BlazeMeter will auto-generate its own. - The bzt.log.
This is the same one you can view individually (refer to The BZT Log in this document). - Various log files generated by whatever testing tool you had opted to run the test with.
- If you ran a JMeter test, JTL files containing the results of the test run will be included.
These can be handy for debugging if you load them into a View Results Tree or similar listener in JMeter. - Any additional files you might have used for that test run (such as CSV data files).
A summary of the files included this ZIP file is displayed as well:

CAUTION! If you terminated the test instead of shutting it down gracefully, or if the test ended prematurely in an unexpected manner, the artifacts.zip will not be generated.
We support uploading files of one session with up to 36 hours (AWS limit). If you run a test for more than 36 hours, you will only see the artifacts for the first 36 hours. The bzt.log also covers the first 36 hours of the test.
The BZT log
Taurus's command-line tool is called "bzt", thus the log Taurus generates during a test is called the bzt.log. This log details all activities performed with by the engine and the tail of this log (most recent 200 rows) can be viewed live while the test is running. This capability is helpful for debugging tests in real time.

Consider the tail of the log in this example, in which an error is shown that gives a better perspective on why the test stopped prematurely:
You can then click the download icon to download the entire log file, or you can download it via the artifacts.zip, where a copy of the log is included.
The JMeter log
If you ran a JMeter test, then the jmeter.log will appear in the log drop-down menu as well.

Most of the content of the jmeter.log is actually included in the bzt.log but the full jmeter.log can be very useful for troubleshooting JMeter-specific issues.
Click the download icon to download the full log file, or you can download it via the artifacts.zip, where a copy of the log is included.
The System log
You can review BlazeMeter's own log by clicking the System Log button.


To download the log, click the download button.
More often than not, the other logs mentioned above will be far more useful in troubleshooting issues, since they relate directly to the test scrip executed, whereas the System Log simply gives you a high-level view of the test's life-cycle, from the moment the test starts to when it is terminated.
For Multi-Tests, this log can be filtered by session.


