Control random test data distributions
Either use fixed test data values from an ordered spreadsheet or get randomized values. You can get completely random data or influence the distribution of the returned values. You can define alternative values or functions and choose a probability for each, as long as the total of the distributions adds up to 100 percent.
Follow these steps:
-
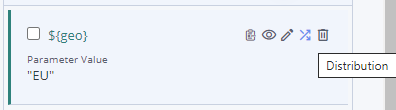
After defining a Data Parameter, click Distribution to define values.
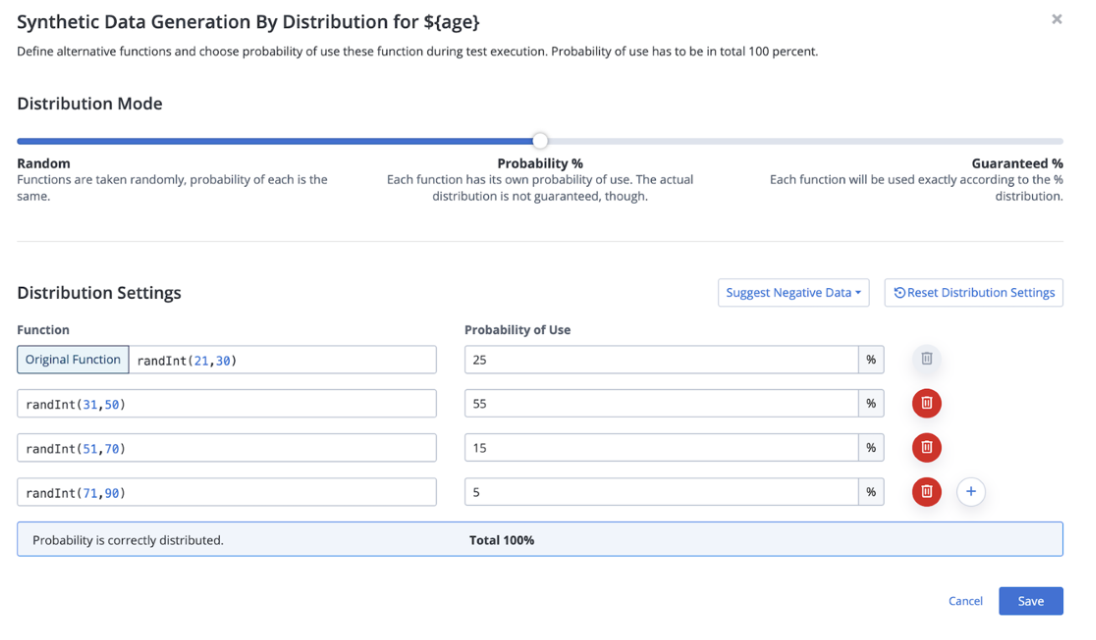
The Synthetic Data Generation By Distribution window opens.
-
Choose a Distribution Mode:
-
Random — Selects values pseudo-randomly. The probability for each is the same, but not guaranteed. This is the default.
-
Probability % — Lets you define a probability for each value, the actual distribution is not guaranteed, though. This means, a 50-50 distribution might end up being 50.1% and 49.9%.
-
Guaranteed % — Each value is selected exactly according to the given percentage distribution. For example, a 25-25-25-25 distribution selects each of the four values in turn.
-
-
Click the Plus button to add alternative values or functions.
-
(For Probability % and Guaranteed % modes only) Define Distribution Settings by entering the desired percentage for each value. The total must add up to 100%.
-
Click Save.
To learn more about chaos testing, see Generate test data for negative tests and chaos testing.