GUI functional test report
Soon after a GUI functional test executes, the test report is available for review. This report is divided into Summary and Details tabs.
-
When you open the report, the Summary tab shows.
-
The Details tab is divided into its own subtabs: Video and/or Selenium Commands, Waterfall, Logs, and Metadata.
If you set blazemeter.videoEnabled to "no" in your Selenium script, only the list of Selenium commands executed will appear instead of a video.
The Summary tab

The Summary tab provides a high-level overview of the test's execution for individual test cases. Here you'll find useful information such as how long the test took to execute, how many test cases were included, how many test cases succeeded, etc.
The Summary report is divided into two sections.
First, the Latest Runs section displays the cumulative statistics of all test sessions.
Latest Runs includes the following:
- Overall test status - The test status, either Passed, Failed or Undefined.
- Overall suite status - (For Test Suites only) The status, either Passed if all tests passed, or Failed if at least one test failed, or Undefined.
- Scenarios passing - Overall number and percentage of passed scenarios for all test cases in all test sessions.
Total test passing - (For Test Suites only)
Total scenarios passing - (For Test Suites only)
- Total data iterations passing - When a data source is used with multiple rows of CSV data to dynamically provide data to the test, this column lists the number of iterations from the rows of data that passed, versus the overall number of iterations.
- Duration - The difference between the "Started" date/time and the "Ended" date/time. Be aware this will span multiple test launches.
- Started - The date and time the first command of the first session was executed.
- Ended - The date and time the last command of the last session was executed.
- Locations - The geographical zone and location where this test was run or if it was a private cloud.
- Show test data - (For tests with test data only.) Review and download the test data that was used. Click the Rerun button here to run an individual test again with the same test data.
Optionally, you can add your own notes in the "Add report notes..." field, then click the Save button to save them to that specific report.
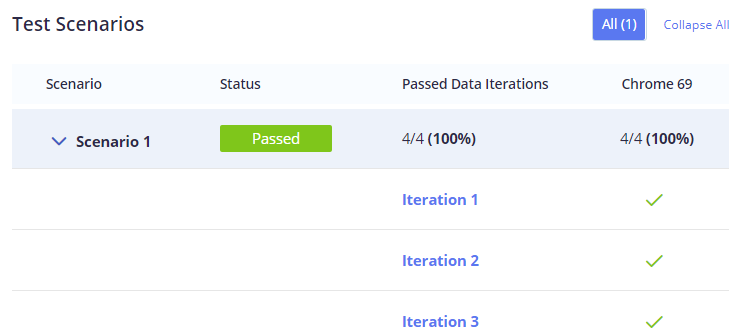
The Test Scenarios section provides additional details specific to each test scenario within the test:
- The test suite and the test scenarios belonging to that suite.
- The Status of the test suite, either Passed, Failed, or Undefined
- Passed data iterations shows the percentage of rows that have passed if you use test data from a CSV file. Otherwise the column is empty.
- The last columns show the status for runs in various browsers, for each test case, and show whether the specific test case passed or failed.
Test cases may have the following states:
- Passed, designated by a green check mark.
- Failed, designated by a red X.
- Undefined, designated by a blue dash, meaning no status was set in the script.
- Broken, designated by an orange exclamation mark, meaning the test could not be executed. Click the exclamation mark to navigate to that test case's description within the Details tab.
Lastly, if you click the browser name in this table, you will be taken to the Details tab for that particular test.
The Details tab
The Details tab provides a wealth of detail about the Selenium test.

You'll likely initially see a spinning progress icon instead while the test starts running. This is ok! The test needs to execute for a time before any data can be displayed.
The Details tab is divided into four sections, listed on the left of the report, and detailed in the following sections below.
Iterations/Sessions
The Details view is broken down by Sessions. When a test is run, each scenario in the test runs in each browser defined for the test. Each of these scenario/browser runs are stored as individual Sessions in the test report.
The results of each Session are viewed one at a time in the Details view, meaning when the Details view is opened, only one session is displayed in the view.
Note: When external data is used, each row/record of data creates a session as well.
To access other sessions:
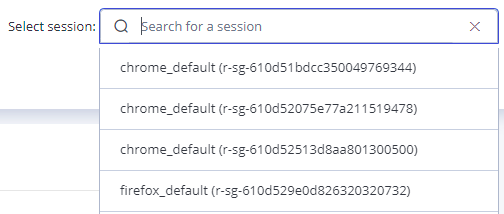
- In the upper-right of the Details view, click the Select field.
A dropdown displays all the sessions in the report with a system-generated name for each Session. - Select a Session to load the data into the Details view.
Note: The Select field only displays in the Details view.
Video/Selenium commands
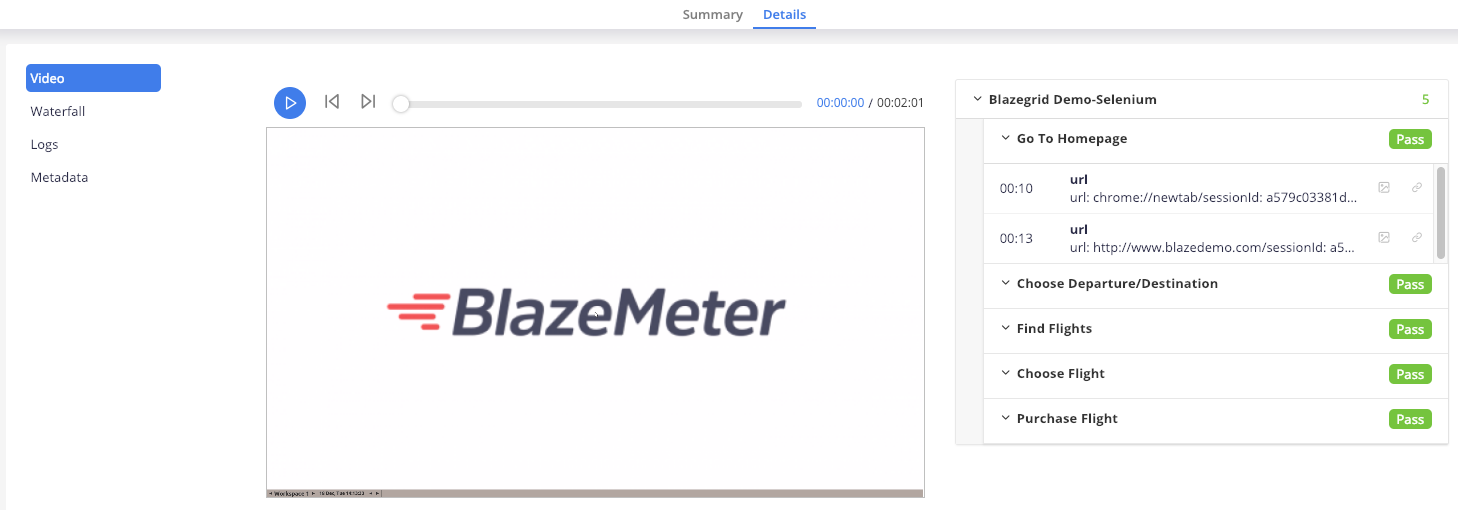
The Video section, the first section displayed when viewing the Details tab, shows both the video recording of your Selenium test executing (in the engine's browser) and a list of all Selenium steps the script executed, organized by test case/suite.
If the video option was disabled in your script, then "Video" will be replaced by "Selenium Commands" and only the list of Selenium steps will be displayed.
You can play the entire video to watch the recording of the script executing from start to finish or you can click individual steps in the Selenium commands list to the right, which will allow you to jump to the timestamp in the video in which that specific step executed.
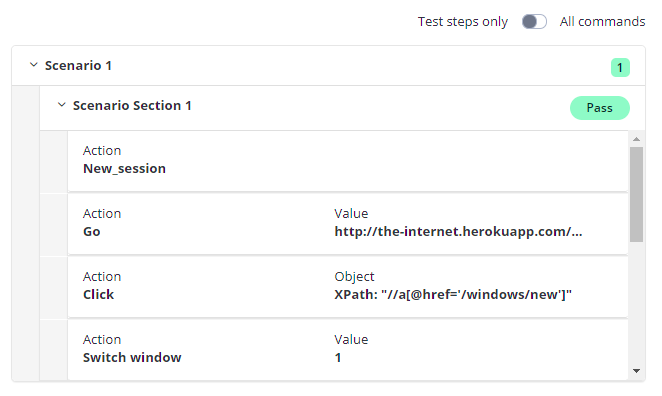
The commands are displayed in one of two modes, selected via the toggle located at the top-right of the commands list:
- Test steps only shows only the commands from the script.
- All commands shows all the commands necessary to launch and run the test.
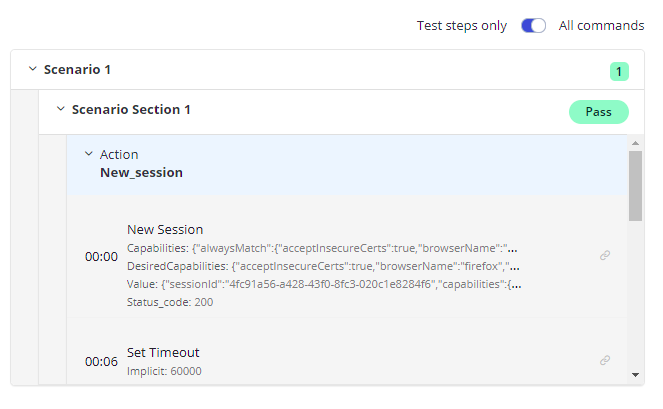
This is especially useful for debugging failed steps. By clicking a command in the list, you can jump to the point in the video in which it executed and the failure occurred. In the event a command had trouble executing during the test, it will be flagged with an orange exclamation mark icon.
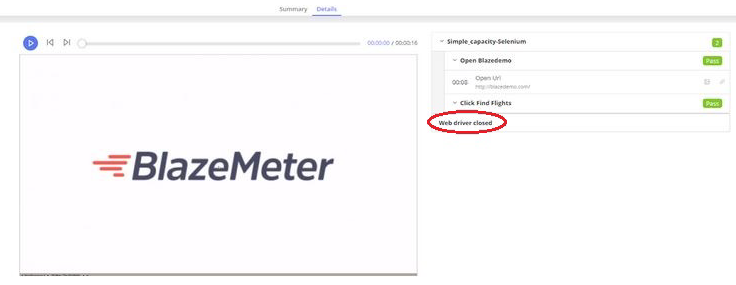
Look for a Webdriver closed command to appear at the end of the list. If this command does not appear, then there was a problem with the test.
Video/Screenshots
In addition to video timestamps, you can also view screenshots, one for each URL navigated by the script. The screenshot icon is located to the right of each URL.

No screenshots are recorded after a go or open action that either goes to a different domain, or that starts from an empty tab. To work around this browser limitation, start your recording on the target page, or click anywhere inside the Recorder Extension after going to or opening a new page.
When a failure or error occurs, generate a link to the specific step with the issue and share it for debugging. To the right of each screenshot icon, click the link button to copy the URL to your clipboard. This link opens the report in the browser for anyone with access to view the report, and jumps to that step in the report.
Waterfall
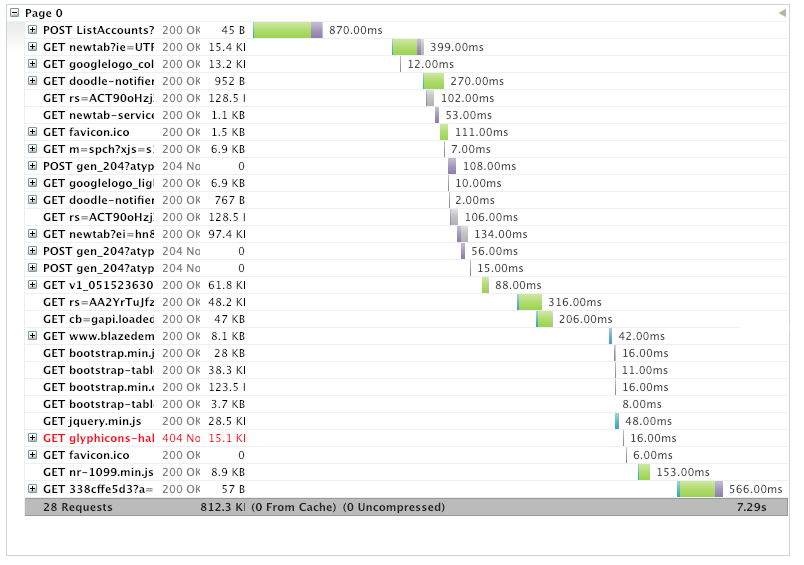
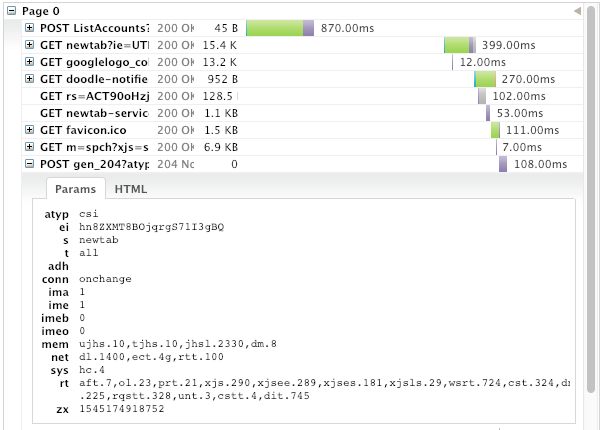
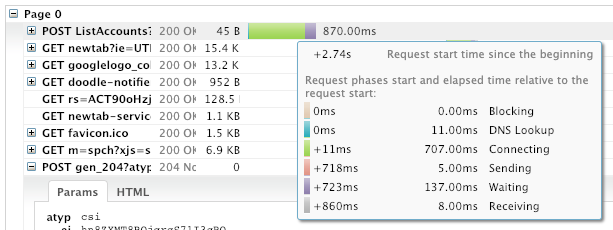
The waterfall report shows the page load time on the network level for each step, which can be useful when looking for any pages that might take too long to load and thus result in a delay in the test.
The waterfall report can aid you in uncovering performance issues. As you review the waterfall report, you can click to expand each performed request to view more details about it. This is similar to what you would see if you were to open the developer tools for a real browser and examine the network tab.
You can also hover your mouse over each graph in the waterfall report to see expanded information on request phases and their elapsed times.
Logs
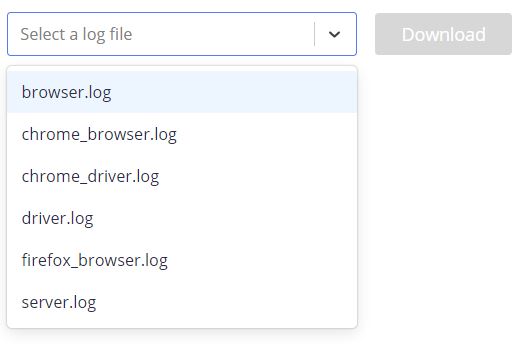
The logs section provides a thorough list of possible logs to refer to.

Click the Select a log file field to open a drop-down menu which will display all logs available for download.
The logs available in this list will vary depending on what options you had chosen when configuring your script and what type of user you are. For example, admin users will have more logs available to view than standard users.
Metadata
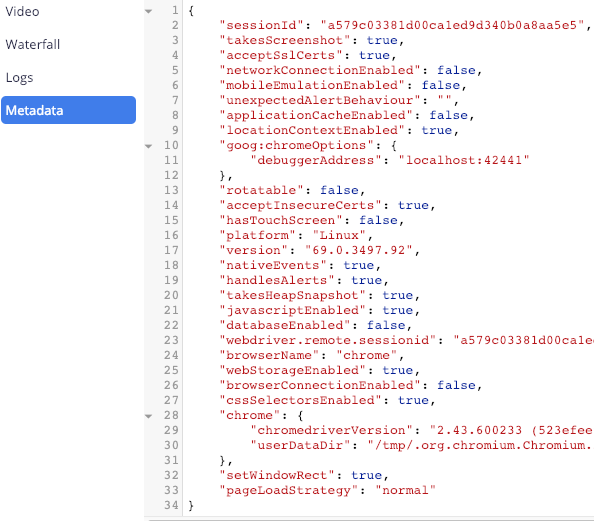
The metadata section displays detailed information pertaining to the test itself.
Here you can find some useful data about the test, such as its session ID, driver used, browser used, etc.
Each command's response includes a delay that is equal to the implicit wait timeout. To shorten this delay, which defaults to 60 seconds, you can change the webdriver's implicit wait parameter within your test script to a value such as 30 seconds.
Errors
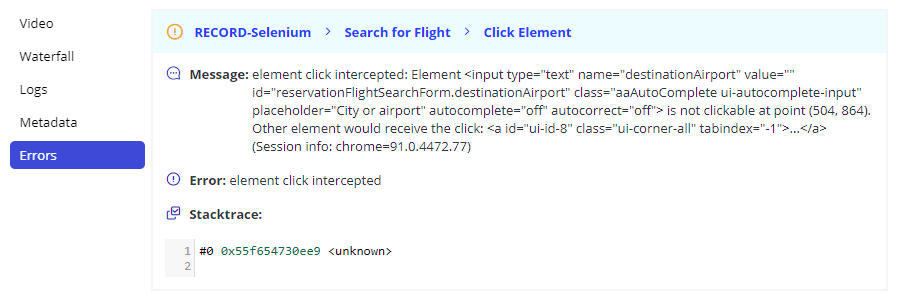
The errors section displays detailed information pertaining to errors found in the test (if any). Clicking on a specific error item will take you to the point where it occurs during the test.
Managing reports
How to rename a report
- Open the report and click in the report name.
- The Name field opens for editing.
- Change the name of the report.
- Click anywhere out of the Name field to save the changes.
How to share a report
When sharing is enabled, anyone with the link can access the report. Every time you disable and re-enable sharing, BlazeMeter creates a new token. Thus previous links to this report won't work anymore.
- Open the report.
- Next to the report name, click the Ellipsis icon.
- Click Share report.
- Enable or disable sharing for this report.
- If you enabled sharing:
Click Copy to clipboard.
Share the report by pasting the link in an email or chat message to the recipient.
How to move a report
Reports are stored in the same project as the test used to create the report, they are tied to the test. Because of this dependency, reports can only be moved to a different project by moving the test to the project.
How to delete a report
- Open the report.
- Next to the report name, click the Ellipsis icon.
- Click Delete and confirm.

