Integrate with Datadog
BlazeMeter provides an integration with Datadog, an Application Performance Monitoring (APM) tool designed for analyzing the performance of application servers, database servers, and web services. You can use this integration for new or existing tests.
This integration supports the following integration modes:
-
Display Datadog Metrics in BlazeMeter: Integrate your BlazeMeter tests with a specific Datadog profile and the scopes it contains. You can configure a test to send requests to your monitored servers, and view metrics collected by the Datadog monitoring tool in the BlazeMeter Timeline Report.
-
Display BlazeMeter Metrics in Datadog: Send test results to the Datadog platform so that you can view and manipulate the test data in Datadog dashboards and the Metrics Explorer. This mode provides real-time reporting of test metrics such as latency, number of hits, users, maximum response time, connect time, and so on.
-
Display Both Ways: Set up this bidirectional mode to send performance test metrics from Datadog to BlazeMeter, and vice versa.
For a demo of how to use the Datadog integration, watch this short video.
Detailed steps follow.
Configure a Datadog key
To use this integration, you first need to create a key associated with a build profile and Datadog API and application keys.
Steps
- Navigate to the BlazeMeter Test Configuration page.
- In the Integrations section, click Datadog APM.
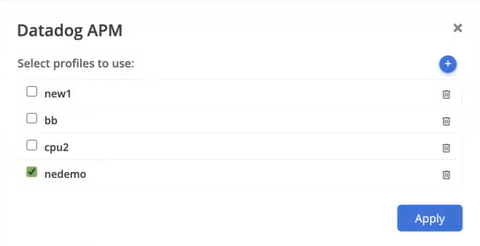
- Either choose an existing profile:
Or create a new profile by entering the following details:
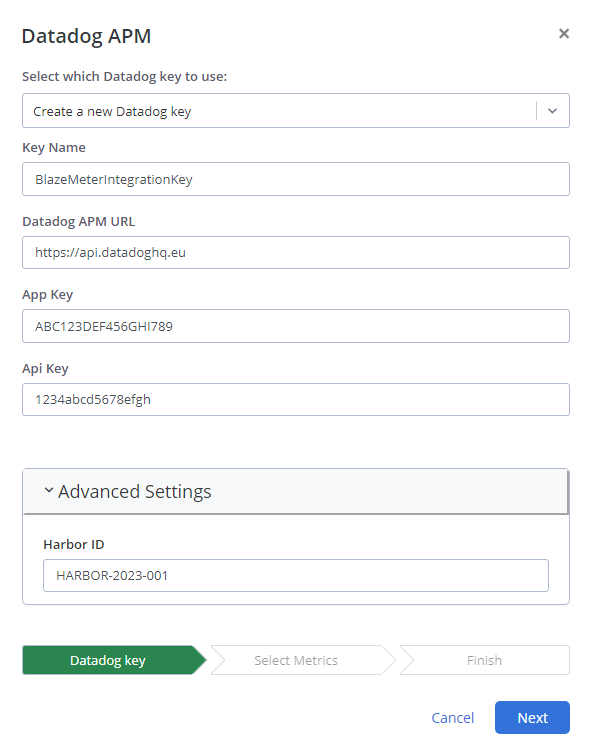
Basic Configuration:
- Key Name: Name of the key you want to create and reference in BlazeMeter
- Datadog APM URL: The full URL to access your Datadog environment (exclude the trailing / in your URL, for example, http://yourHostAtDatadog.com).
- App Key: Authentication key, used in conjunction with your organization’s API key, that gives users access to Datadog’s programmatic API.
- API Key: Authentication key granting BlazeMeter access to Datadog's API for data transmission and retrieval. API keys are unique to your organization. An API key is required by the Datadog Agent to submit metrics and events to Datadog. For more information, see Datadog documentation.
Advanced Configuration:
- Harbor ID: The private location to use to run the APM functionality (for information where to get this value, see Find the harbor ID and ship ID).
If you're using Datadog in the cloud, you don't need to provide the Harbour ID. The integration will work seamlessly without it.
You have completed the Datadog key step in the setup wizard. You can click Next to proceed to the Select Metrics step in the wizard.
Display Datadog metrics in BlazeMeter
Choose the Display Datadog info in BM integration mode to pull APM metrics from Datadog according to your profile setup to view in the BlazeMeter Timeline Report.
Prerequisites
A Datadog key is configured (see Configure a Datadog Key).
Steps
-
In the Datadog integration setup wizard, after completing the Datadog key step, click Next.
The Select Metrics screen opens. Here you can select your metrics and construct your profile. You specify your entity type and the metrics to include in the Timeline Report.
-
Select the Datadog info in BM option.
-
From the dropdown, select a reserved tag key for example, Hosts, and an associated entity.
-
From the Select Entity dropdown, select one or more metrics, and click Next.
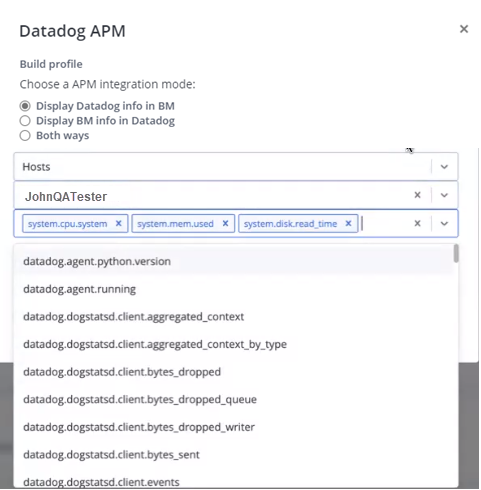
This action lets you preview what your profile will monitor.
-
Provide a profile name and click Save Profile to save it as a new profile for future tests.
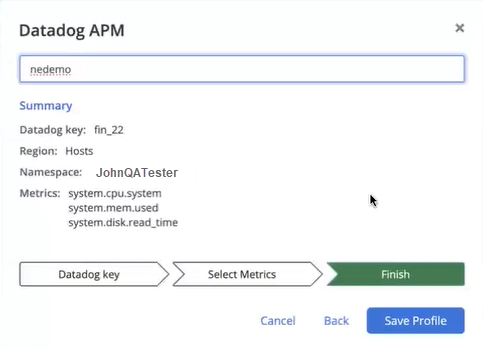
-
Upon saving your profile, you'll see the following screen, allowing you to choose the profile(s) you want. To apply the profile(s) to your test, click Apply.

Your test is now integrated with Datadog.
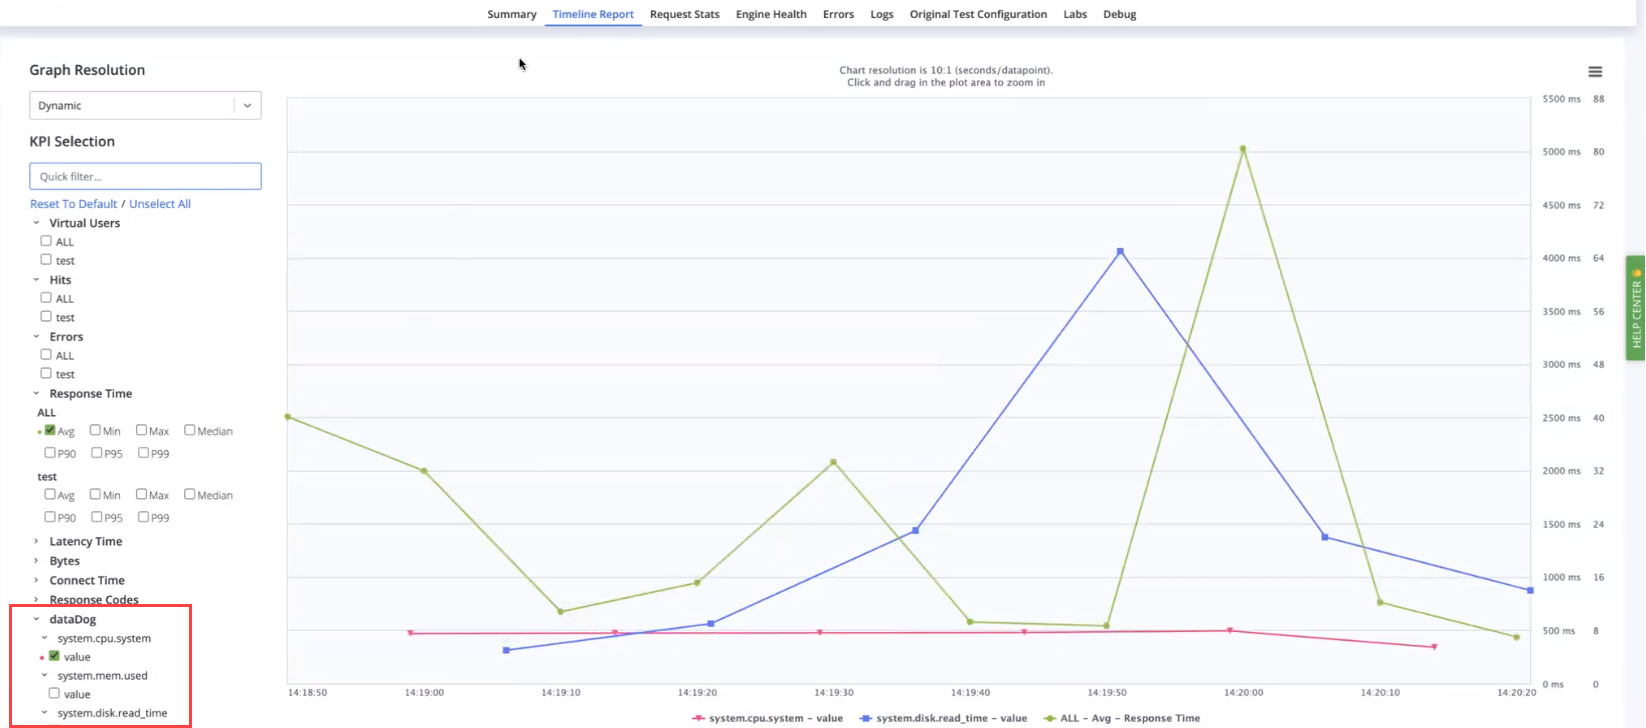
To view the test metrics from Datadog, go to the Timeline Report, scroll to the bottom of the available KPIs, and then expand the Datadog section. You will then see all the metrics you selected listed there. You can click the checkboxes to add them to your report, an example of which you can see below:
Display BlazeMeter metrics in Datadog
Choose the Display BM info in BM integration mode to push metrics from BlazeMeter into Datadog according to your profile setup. You assign tags to the transmitted data, so that you can use them to filter and group your data in your Datadog platform. Tags can be used to include or exclude data.
When configured, BlazeMeter sends the following load test metrics to Datadog:
| Metric name | Description |
| bzm.bandwidth.avg | The average bandwidth usage measured in bytes per second during a BlazeMeter load test. |
| bzm.connectTime.avg | The average time taken to establish a connection with the server during a BlazeMeter load test. |
| bzm.errors | The total count of errors encountered during a BlazeMeter load test. |
| bzm.errors.avg | The average number of errors encountered during a BlazeMeter load test. |
| bzm.hits | The count of HTTP requests or transactions executed during a BlazeMeter load test. |
| bzm.hits.avg | The average number of HTTP requests or transactions per second during a BlazeMeter load test. |
| bzm.latency.avg | The average latency, representing the time delay between sending a request and receiving the first byte of the response during a BlazeMeter load test. |
| bzm.responseTime.avg | The average response time for all executed requests during a BlazeMeter load test. |
| bzm.responseTime.max | The maximum response time recorded for executed requests during a BlazeMeter load test. |
| bzm.responseTime.min | The minimum response time recorded for executed requests during a BlazeMeter load test. |
| bzm.responseTime.percentile.50 | The 50th percentile response time, indicating the point below which 50% of the executed requests fall in a BlazeMeter test. |
| bzm.responseTime.percentile.90 | The 90th percentile response time, indicating the point below which 90% of the executed requests fall in a BlazeMeter test. |
| bzm.responseTime.percentile.95 | The 95th percentile response time, indicating the point below which 95% of the executed requests fall in a BlazeMeter test. |
| bzm.responseTime.percentile.99 | The 99th percentile response time, indicating the point below which 99% of the executed requests fall in a BlazeMeter test. |
| bzm.users | The number of virtual users or simulated clients generating load in a BlazeMeter test scenario. |
Prerequisites
A Datadog key is configured (see Configure a Datadog Key).
Steps
-
In the Datadog integration setup wizard, after you've successfully added your key, click Next.
-
Select Display BM info in Datadog.
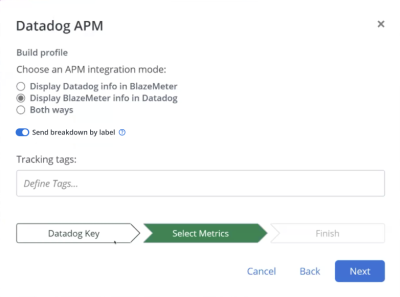
-
Enable Send breakdown by label to send your Blazemeter labels to Datadog. When enabled, your labels appear under Tag next to the masterid in Datadog.
-
In the Tracking tags text box, type one or more tags.
To familiarize yourself with Datadog tagging requirements, see Datadog documentation. -
Click Next to preview what your profile will monitor. Provide a profile name and save it as a new profile for future tests.
-
Provide a profile name and click Save Profile to save it as a new profile for future tests.
-
Upon saving your profile, you'll see the following screen, allowing you to choose the profile(s) you want. To apply the profile(s) to your test, click Apply.

Your test is now integrated with Datadog.
To view the load test metrics in Datadog, go to the Dashboard or Metrics Explorer.
Display Both Ways
Choose the Both Ways integration mode to push metrics from BlazeMeter into Datadog and vice versa, according to your profile setup. This configuration combines the Display Datadog metrics in BlazeMeter and Display BlazeMeter metrics in Datadog modes.
Prerequisites
A Datadog key is configured (see Configure a Datadog Key).
Steps
-
In the Datadog integration setup wizard, after you've successfully added your key, click Next.
-
Select the Both Ways option.
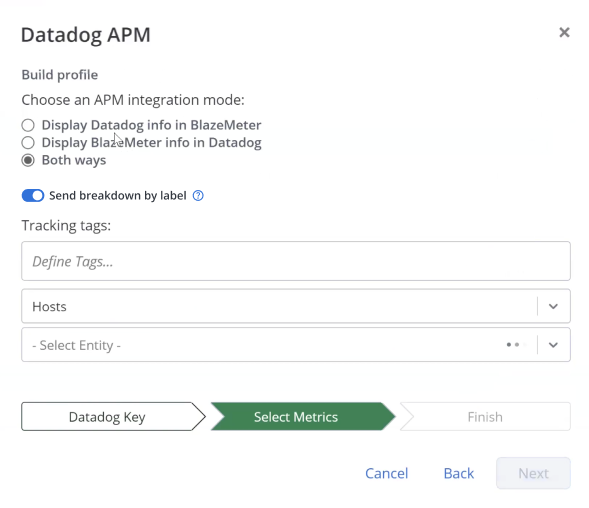
-
Enable Send breakdown by label to send your Blazemeter labels to Datadog. When enabled, your labels appear under Tag next to masterid in Datadog.
-
In the Tracking tags text box, type one or more tags.
-
From the dropdown, select a reserved tag key for example, Hosts, and an associated entity.
-
From the Select Entity dropdown, select one or more metrics.
-
Click Next to preview what your profile will monitor. Provide a profile name and save it as a new profile for future tests.
-
Upon saving your profile, you'll see the following screen, allowing you to choose the profile(s) you want. To apply the profile(s) to your test, click Apply.

Your test is now integrated with Datadog.
You can view the load test metrics in BlazeMeter and in Datadog.

