End user experience monitoring
To gain better understanding of real user experience of your application server performance under load, enable the End User Experience (EUX) Monitoring option in BlazeMeter while running a load test. EUX monitoring is available only for Pro or higher subscription plans.
For example, you might find that your backend can handle the load, but the page takes ten seconds to reach a state that is adequate for a user to interact with. The waterfall report can aid you in uncovering performance issues like page loading in the browser — issues that JMeter alone is not able to identify.
The EUX procedure consists of the following steps:
How monitoring works
End User Experience Monitoring uses Taurus to execute a Selenium test (YAML) in the background while your load test is running. The goal of EUX is not to report whether the functional test passes; EUX only uses the test to capture response times. The Waterfall Report surfaces the load times that users experience in their web browsers at different points during the load test. This is especially helpful when trying to debug why a page failed to load properly from the users' point of view at a certain point in the load test.
When a test is executed with End User Experience Monitoring enabled, BlazeMeter wraps the label and the URL specified with a YAML configuration file. Alternatively, you can supply a YAML script of your own. BlazeMeter executes the YAML script via Taurus and Selenium for the full duration of the load test.
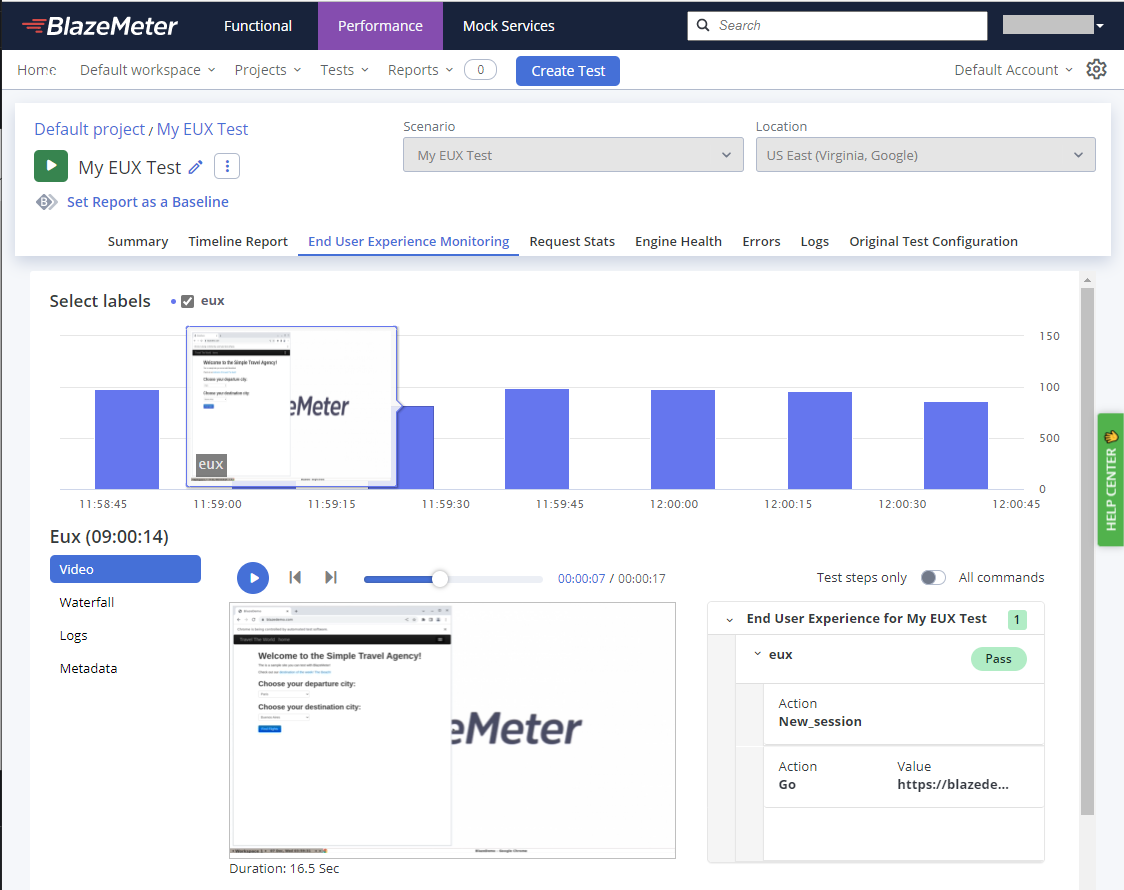
The End User Experience Monitoring report can record videos that reflect the user experience of opening the URL or running the Selenium scenario. For each choice of browser and version, the test report includes a video of the test execution. By default, video recording is enabled. In addition to the waterfall view, you also see test steps, logs and metadata.
Requirements for end user experience monitoring
EUX monitoring is available only for Pro or higher subscription plans. Tests with EUX monitoring configured require at least four engines:
-
One engine for the performance test.
-
Three engines for the Selenium test.
Prerequisites
-
Ensure your workspace is on a Pro plan or higher to meet engine requirements and access EUX features. Multiple URLs can only be monitored with paid plans.
-
Verify you have enough concurrent engines available in your plan to avoid test interruptions. Pro plans and higher support up to 20 concurrent engines, which is essential for running EUX tests.
-
EUX tests don’t run on Private Locations that have more than one agent. To run EUX tests, ensure to have only a single agent assigned.
Configure end user experience monitoring
Follow these steps:
- Open the Performance tab.
- Click Create Test and click Performance Test, or open an existing test.
- Scroll down to the End User Experience Monitoring section and toggle the button ON.
- Choose one of the following options:
- URL list
The EUX test opens one or more specified web pages. See Choose a URL to Monitor. - Selenium Scenarios
The EUX test performs the steps defined in the scenarios. See Upload Selenium Scenarios.
- URL list
Choose a URL to monitor
To test the user experience of opening one page, follow these steps:
- In the URL list tab, specify at least one URL to monitor during the test.
- Start each URL with either "http://" or "https://".
- A empty line to add another URL appears automatically.
-
For each URL, enter a label name to identify this test case later in the report.
Upload Selenium scenarios
Instead of specifying only URLs, you can upload Selenium scenarios to run via Taurus.
Follow these steps:
-
Create a Taurus YAML configuration to execute your Selenium scenario and upload it to the test.
End User Experience Monitoring only supports YAML files in which the Selenium scenario is scripted within the YAML. It does not support pointing a YAML to a separate script, such as one written in Java or Python. -
Identify the test's "Start test with:" property. Ensure that the Performance test script is still selected as the main file, and not the Selenium scenario.
In the following sample screenshot, you see that the JMX file is correctly selected: -
On the Selenium Scenarios tab, select the boxes for scripts that you want to execute as monitoring tests.
- Define the test execution settings.
- Run the test.
Define test execution settings
For End User Experience Monitoring tests, you can define Location and Browser:
- Location:
Choose a public Cloud location, or a private location for test execution. For more information, see Cloud vs Private Location and Get the Location Name.- The choice of location also determines which browsers are available.
- When you do not select a location, the EUX test uses the default location for GUI Functional tests.
- Browser:
(If the test has a location assigned:) Choose browser and browser version. For each choice of browser and version, the test report includes a video of the test execution. For more information, see Supported browsers.- Each test can be run in multiple browsers and multiple versions.
- By default, and if no location is selected, the EUX test runs in the latest Chrome browser.
- If you have created a private location that has custom browsers and versions configured, you can select additional browsers.
Run the test
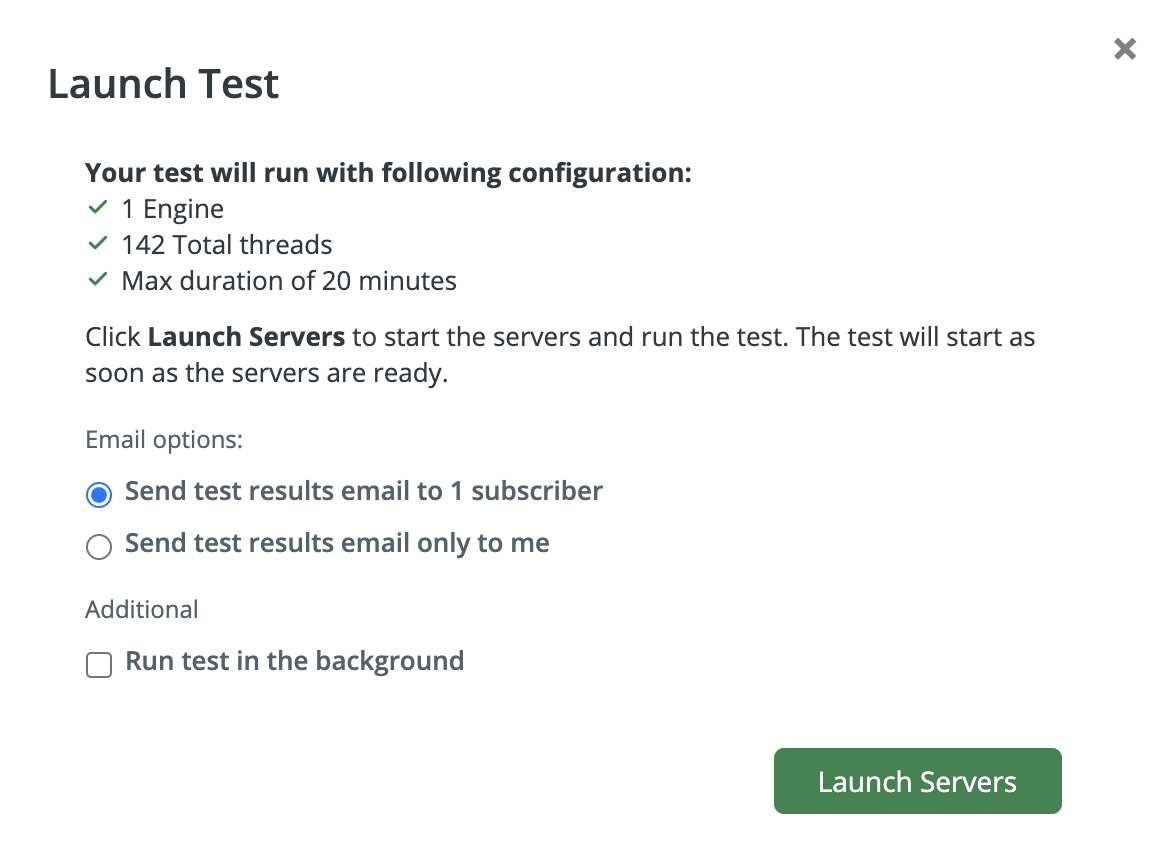
After specifying either the URLs to access or uploading your Selenium scenarios, click Run Test.

After the test starts, you see both the load test and the user experience monitoring test executed simultaneously.
When the test report appears, you see the report tabs and the End User Experience Monitoring tab.
View the report
There are two ways to view the End User Experience Monitoring report:
- If you want to go straight to the monitoring report, navigate to the End User Experience Monitoring tab.
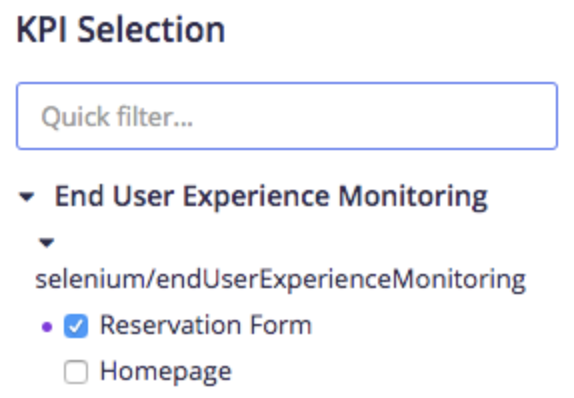
- If you want to see monitoring results alongside other test metrics first, navigate to the Timeline Report tab. Under the KPI Selection on the left, expand the Real User Experience section.

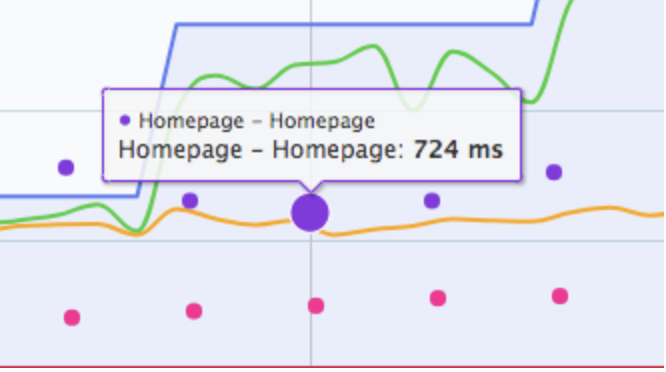
You will find your named label(s) for your monitored URL(s). Select a label and it will be displayed as a series of dots on the graph.
The vertical Y axis represents page load time in the web browser. The horizontal X axis represents time. Each single dot represents the execution time of the Selenium test at a specific moment in time, where higher dots represent longer execution time.
Click a dot to open the End User Experience Monitoring tab.

View the end user experience monitoring tab
Regardless of which of the two methods you choose to follow from above, click the End User Experience Monitoring tab to see a graph consisting of individual timeline columns.

Each column in this graph for a label correlates with each dot in the Timeline Report for the same label.
View the waterfall report
To open a waterfall report for that moment in time, click a column in the monitoring report.
The waterfall report shows what your users experience when your site is under load. The time shown for each horizontal bar refers to the page load time on the network level.
As you review the waterfall report, you can click to expand each performed request to view more details about it. This is similar to what you would see if you were to open the developer tools for a real browser and examine the network tab.
You can also hover your mouse over each graph in the waterfall report to see expanded information on request phases and their elapsed times.
The waterfall report reveals how long each request took and which requests had the most impact on page load time.


