Errors report
The Errors tab contains the errors that were received by the web-server under the test as a result of HTTP request. The report displays all errors received during the test run, categorized by labels (pages) and error types.
View Errors report
Follow these steps:
- In the Performance tab, select Reports. The most recent reports are shown on top.
- Click Show all reports and select a report to view its details.
-
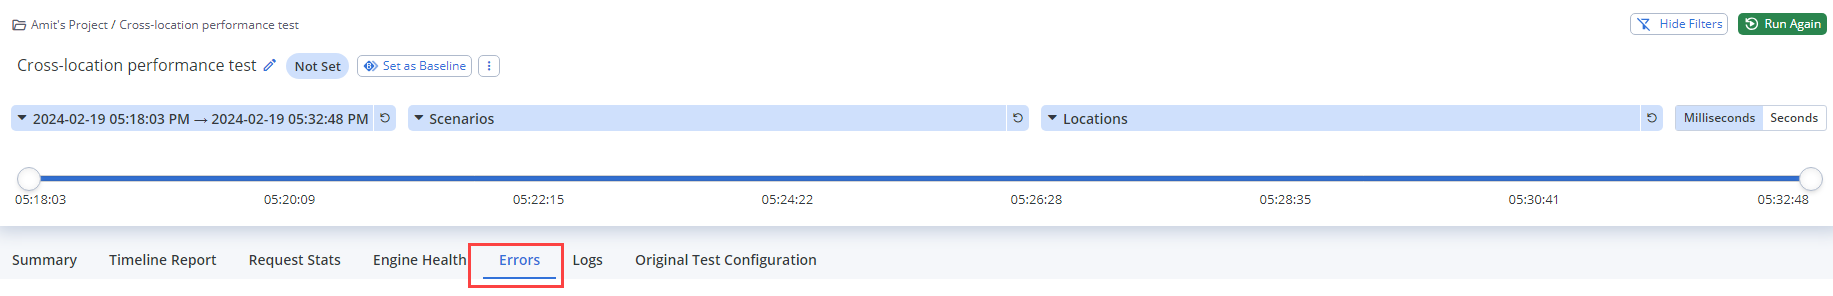
Click the Errors tab.

You can see all errors received during the test run.
-
(Optional) Move the timeline sliders or Filter by Date and Time to narrow down the time. The results for your selected time period will show in the results table.
- Group errors by:
- Label
- Response Code
- Assertion Name

Types of errors
We report these types of errors:
- Top requests
- Assertions
- Failed embedded resources
For each error, the following information displays:
- Response code
- Response message
- Number of failed requests
View the response body
You can access the response data of failed samples on the Errors tab. This feature can help you:
-
Quickly identify problems
-
Save time searching through logs
-
Instantly see issues during test runs
-
Avoid excessive memory usage on local machines
Admins and account owners can enable or disable this feature on the account settings page. For more information, see Manage Environments.
Key Features
-
First 10 Unique Errors. Only the first 10 unique error response bodies per scenario or test are displayed. This constraint is designed to help manage storage and performance.
-
Live Display. The response data is available while the report is running, not just post-completion.
-
Scope. This feature is available for all performance tests, shared reports, external reports, and multi-test reports.
Steps
-
Open a test report and navigate to the Errors tab.
-
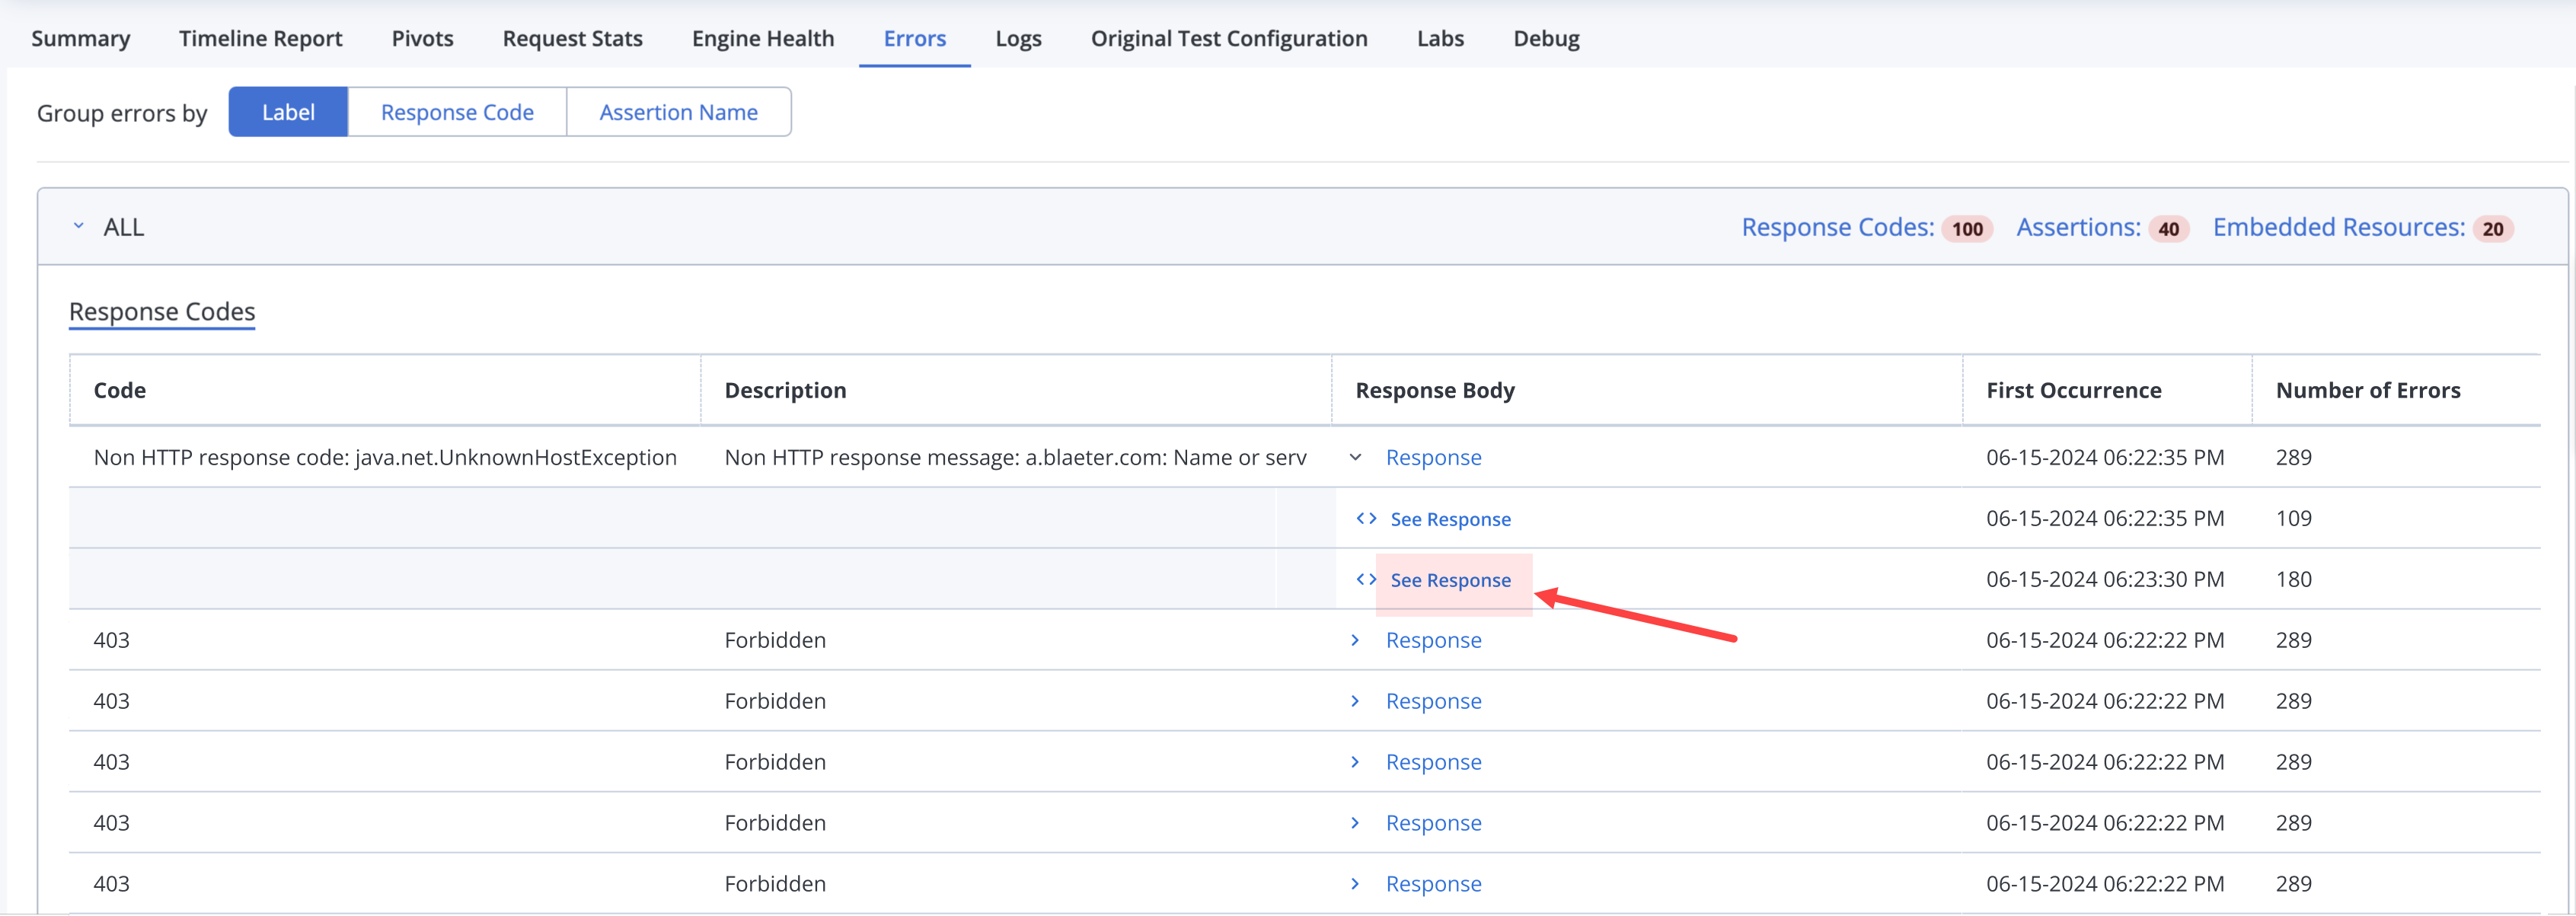
In Group errors by, select Label, Response Code, or Assertion Name.
The Response Codes table opens, containing the following columns:
- Code - Lists the specific error codes detected.
- Description - Provides a brief description of each error.
- Response Body - Contains links labeled `Response` that you can click to view the detailed error response body.
- First Occurrence - Shows the time stamp of the earliest occurrence of an error or error response body during a test. This information can help you identify and address the root cause of issues by showing the initial instance of errors.
- Number of Errors - Shows the number of times each error occurred during the test.
-
In the Response Body column, click any table cell containing a Response link.
If response data exists, one or more See Response links are shown.
-
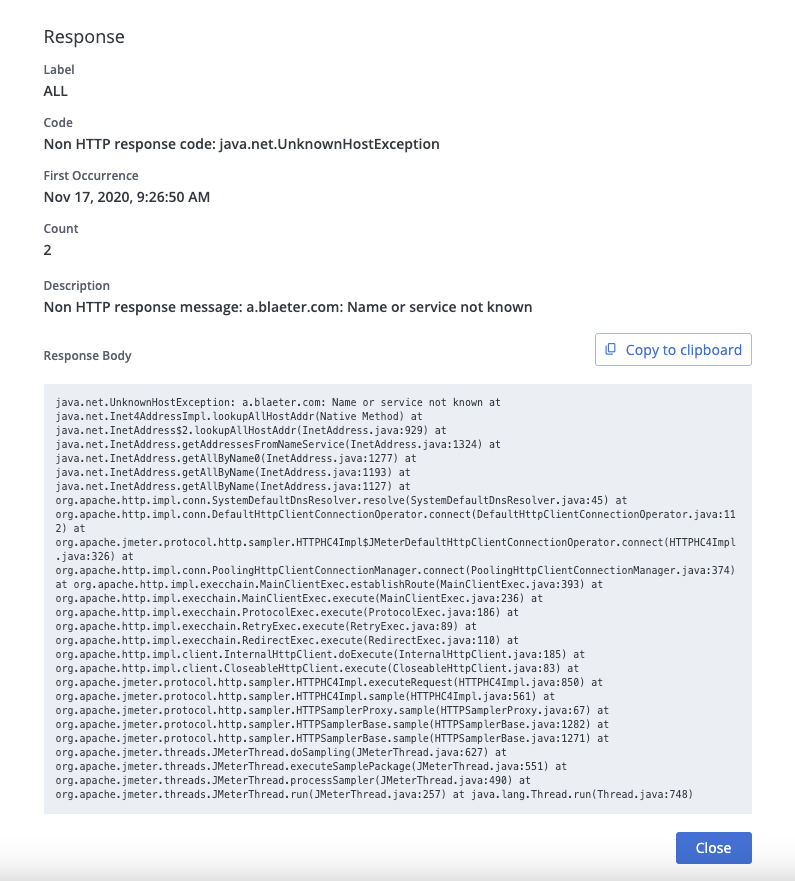
To open a detailed view of the specific error response body, click See Response. The data is shown in raw HTML format. The dialog contains the following fields:
- Label - Indicates the type or category of the response.
- Code - Displays the specific error code.
- First Occurrence - Shows the time stamp of the earliest occurrence of an error or error response body during a test. This information can help you identify and address the root cause of issues by showing the initial instance of errors.
- Count - Indicates the total number of times the error occurred.
- Description - Contains a brief description or message associated with the error.
- Response Body - Displays the detailed error response body, including the stack trace.
-
(Optional) Click Copy to clipboard to copy the response body.
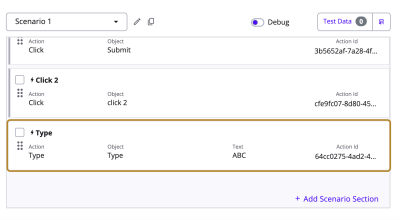
Browser-based testing Errors report
When viewing an Errors report for a Browser-based test, you can view the scenario step where the error occurred. To view the error, scroll to the error and click the link in the Description column. BlazeMeter takes you to the highlighted scenario step with the Action ID where the error occurred. If the scenario step is located within a group, open the highlighted group to view the scenario step with the error.
Jump to next section: