Over time, BlazeMeter's functionality has been expanded to accommodate you throughout the whole Continuous testing journey.
Functional and Performance Tests
The user interface distinguishes between Functional and Performance categories. This is simply to help with organization.
-
When the Functional tab is active, only items relating to functional tests are shown.
-
When the Performance tab is active, only items relating to performance tests are shown. Examples of Performance tests are JMeter tests, URL/API Performance Tests, and Multi-Tests.
Service Virtualization
The Service Virtualization tab lets you create "stand-in" services for real live services that you have no control over, or that are not ready to use yet. Virtual services can be stateless or stateful. Substituting services can be a powerful tool for testing purposes.
Click here to learn how create your first test leveraging virtual services!
Test Data
The test data integration spans across all components: Functional tests, Performance tests, API monitoring tests, as well as virtual services can load synthetically generated test data and custom CSV files.
The Test Data subtabs are where you define and store account-wide shared data entities that provide consistent values for all test types and for all team members.
API Monitoring
The API Monitoring tab helps you monitor public, private, and third-party APIs in seconds, as well as evaluate the uptime, performance and correctness of an API.
As an existing BlazeMeter user, you are likely already familiar with BlazeMeter's features for performing functional or performance API tests. API Monitoring brings additional layers of API-related functionality. For example, once you've verified your APIs are working via functional tests, API Monitoring will help you ensure they remain functioning going forward.
For BlazeMeter users not already familiar with Runscope, there are some settings and permissions specific to API Monitoring that you'll want to be aware of:
- Some settings specific to API Monitoring are in a separate menu apart from other BlazeMeter settings. On the API Monitoring tab, look for a face icon under your name, like this:
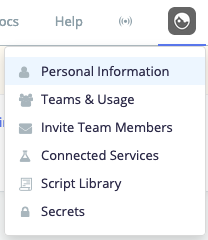
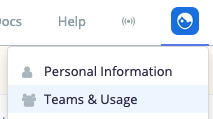
Clicking the face icon above opens this drop-down menu: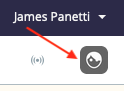
- BlazeMeter testing workspace membership is wholly separate from API Monitoring team membership. In other words, you are likely already familiar with how workspace membership works, as can be seen from your main BlazeMeter settings:
These being the workspaces you access from the main dashboard like so: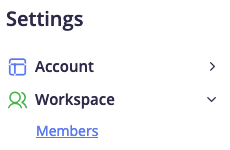
The important detail to remember is that API Monitoring teams are wholly apart from workspaces and are accessed via their own menu, like so: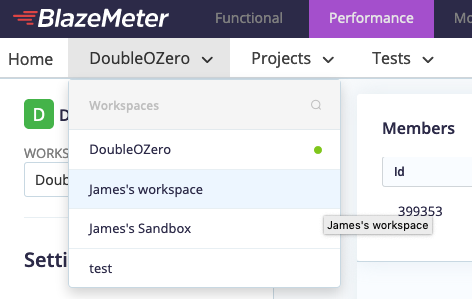
We certainly understand that this division of user roles and permissions as presented here can take some getting used to. We're working on simplifying this functionality in future releases.
Ready to learn more?
First, you can revisit our Getting Started guide if you're like to review some of the functionality you're likely already familiar with. Even so, you may find that the recent updates to the guide make it worth a second look, and the guide includes many links to other various features, new and old alike.
Make sure to learn about The Continuous Journey, if you haven't already, for an overview of the big picture.
To learn how to make the most of any of the above tools, sign up for free courses at BlazeMeter University!