Getting started
BlazeMeter is designed to be intuitive and user-friendly—but everyone needs a bit of help getting started.
If you're entirely new to BlazeMeter, continue reading. If you're a Runscope user new to BlazeMeter, First review our BlazeMeter for Runscope users guide. If you're an existing BlazeMeter user, first see our guide BlazeMeter updates for BlazeMeter users.
- Create your account
- The drop-down menus
- Account Admins: Workspace and Admin Views
- The navigation bar
- Create your first test
Create your account
First, you need a BlazeMeter account. If you don't have one, set one up now—its free!
The welcome screen
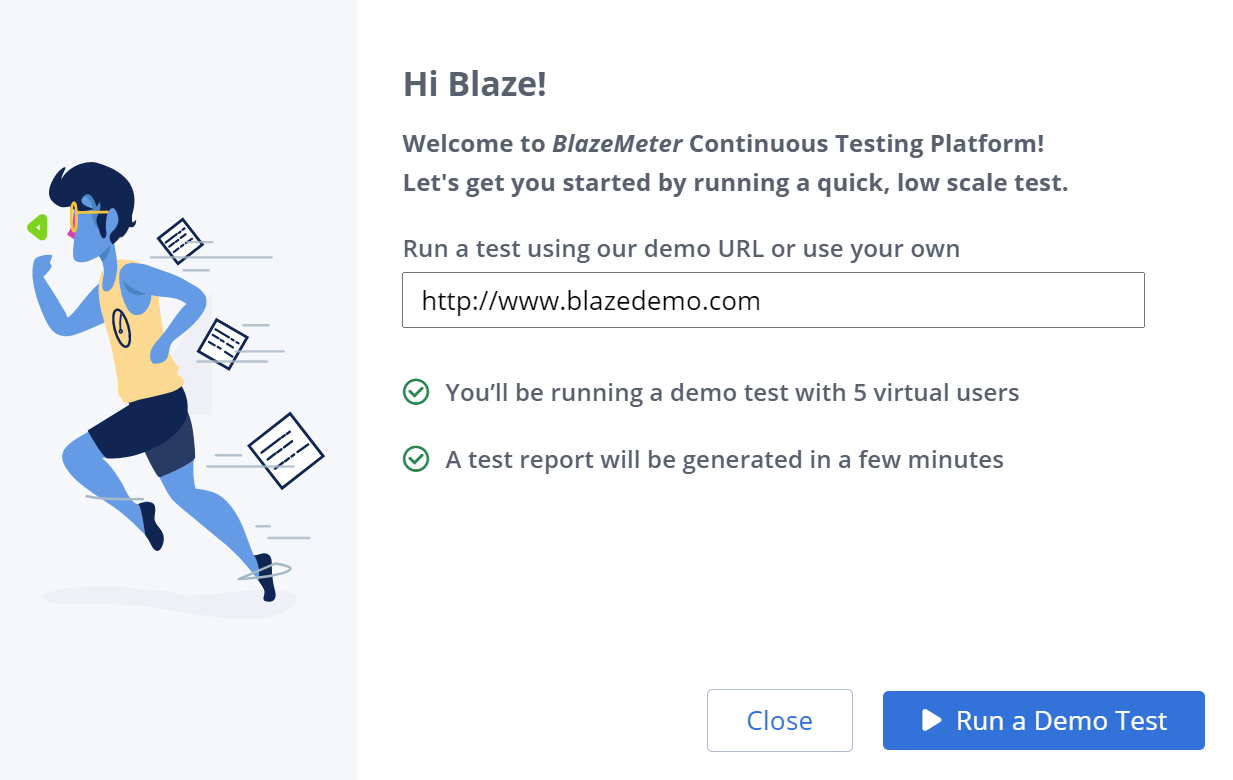
Anyone who is invited to an account, or signs up for the first time, will receive the following welcome screen to run a demo performance test:
Run a demo test using the BlazeMeter demo URL (or enter your own web site URL) to see how performance tests are run in BlazeMeter.
The drop-down menus

Next, let's look at the drop-down menus. In the upper right-hand corner of the screen, you'll find menu items which relate to your account and settings. Starting from top-down and going left to right:
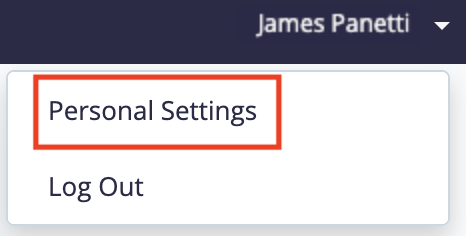
- Log Out - Click your name to open a drop-down menu and click Log Out.
- Personal Settings - Click your name to open a drop-down menu and click Personal Settings.
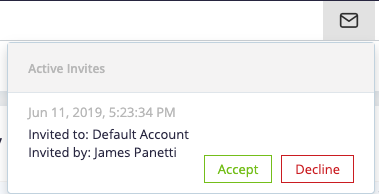
- Active Invites - The mail icon only appears when you have a pending invitation to a BlazeMeter testing workspace. Click the mail icon to open a drop-down menu to see pending invitations which you can accept or reject.
- Invite New Members — Click this icon to send out invitations to users to join your account or review pending invitations.

- Accounts — This drop-down menu, displayed as the account name you are currently viewing, will only appear if you are a member or owner of more than one account (such as a personal account and corporate account). It lists all accounts you are a member or owner of, allowing you navigate between them.
- Settings — Click the Cog icon
 at the top right of the BlazeMeter UI to open the Settings.
- Personal Settings — Create your API Key, change your password, change your default test location, or choose a different time zone.
- Account Settings — Manage users, workspaces, billing, and more.
- Workspace Settings — Manage team sharing, external connections, and which users work in which workspaces.
Account admins: Workspace and Admin Views
Directly under the drop-down menus are two options for adjusting your view: the Workspace View and the Admin View.
The Workspace View is selected (blue) by default. This is where you view everything in your workspace - tests, reports, etc.

Admins can click the Admin View to see admin-specific information.

The Admin View shows all currently running tests (if there are any).
When a test is running, the view shows the test name, type, the project and workspace it is under, and other information, including who started the test.
Click either drop-down to select an option to filter the view by.
The navigation bar
This section of the Dashboard has two rows. The top row features a selection of tabs, while the second row features a number of navigation menu items.
The first navigation row includes these tabs:
- Functional - When this tab is selected, only items relating to functional tests are available. The Create Test button will only provide functional test options, and only functional tests and their reports will be visible.
- Performance - When this tab is selected, only items relating to performance tests are available. The Create Test button will only provide performance test options, and only performance test and their reports will be visible. (The Performance tab is the default tab selection.)
Think of the Functional / Performance tabs as filters. Only one of the two tabs can be active at a time. Only features, tests, and reports relating to the highlighted tab will be available while that tab is highlighted.
- Service Virtualization - A virtual service is a "stand-in" or substitute for a service that your test depends on. This feature allows you to test even when you don't have access to a full test environment.
- API Monitoring - Allows you to monitor public, private, and third-party APIs in seconds, as well as evaluate the uptime, performance and correctness of an API via API tests.
- Search - The search field in BlazeMeter header offers a textual search by name for tests and reports.
The search field is only visible for Performance and Functional tabs.
Quick search for tests and reports
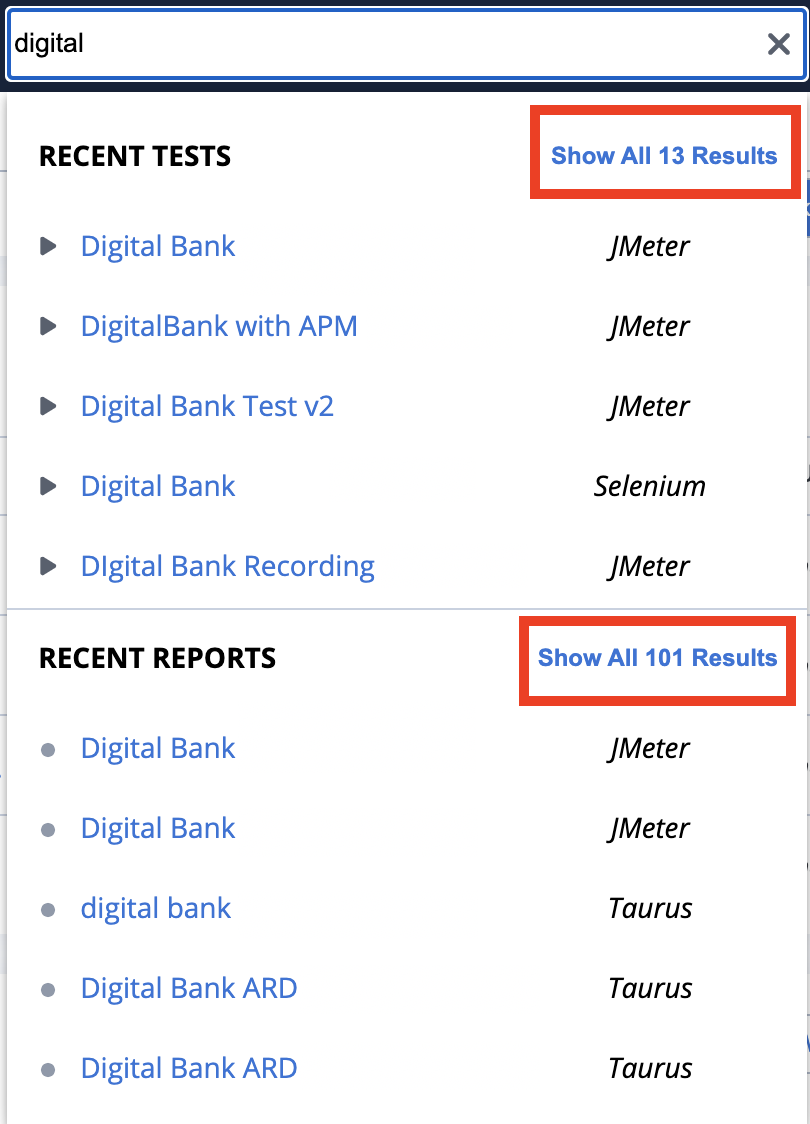
You can quickly search within the tab for tests and reports by their name, without having to go through “Show All Tests” or “Show All Reports” side bars.
Follow these steps:
- Navigate to the Performance or the Functional tab.
- In the search field, enter a test name or a report name.The search is not case sensitive.
The field displays the top 5 recently updated tests, and top 5 recently executed reports that match your search. - To see the full list of results, select Show All Results for test or reports.
The side bar with Test or Reports shows on the left. The reports are sorted by execution date and the tests are sorted by update date.
Navigation menu
The second row provides the navigation menu. The menu differs based on the tab you selected in the first navigation row.
If you selected Functional or Performance:
- Home - Return to the main home page (the default view when you first login).
- Workspace - This lists all the workspaces you are a member or owner of. (If you have more than one account, it lists the workspaces you are a member/owner of for the currently selected account.)
- Projects - View your recently visited projects within the workspace you are currently viewing. To open a sidebar with the entire list of projects you have within the workspace you are currently in, click Show all projects at the bottom of the list.
- Tests - View your recently visited tests. To open a sidebar with the entire list of tests you have within the workspace you are currently in, click Show all tests at the bottom of the list.
- Reports - View a list of your recently visited test reports. To open a sidebar with the entire list of reports you have within the workspace you are currently in, click Show all reports at the bottom of the list.
- Active Runs - This appears as a number ("0" in the above screenshot) and represents the number of tests currently active. Hover your mouse over this number to see a breakdown of how many tests are currently running in the current workspace and how many are running across all workspaces.
- Create Test - Click this button to create a test of the test type you have selected, either Functional or Performance. Alternatively, you can use a Recorder to create tests.
If you selected Service Virtualization:
- Virtual Services - This tab shows list of available virtual services, Virtual Service Groups, and Virtual Service Templates.
- Asset Catalog - Asset Catalog is a single place to store transactions to find and view any available virtual service.
- Analytics - This tab shows analytics for virtual services. To better understand usage and behavior of a particular virtual service and to troubleshoot performance or matching issues, use Analytics for access to reporting, inspection and tracking data. For more information, see Analytics for Transaction Virtual Services.
- Learn More - Click this tab for additional resources on virtual service and continuous testing.
Virtual services can be used stand-alone as look-up services, or to amend other test types. For more information, see the Service Virtualization documentation.
If you selected API Monitoring:
This menu takes you to the API Monitoring UI. For more information, see the API Monitoring documentation.
Create your first test
Congratulations! You've set up an account and you're ready to create your first test with BlazeMeter. Here we will cover creating Functional Tests and Performance Tests. Later, you can amend your test set with Service Virtualization or API Monitoring.
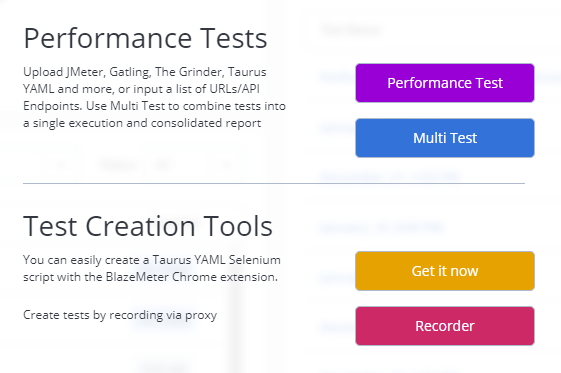
If you have the Performance tab selected and click Create Test, you have the following options:
- Performance Test - Upload your own script, or enter URL/API Calls for a no-scripting option. Performance Tests run via Taurus, which supports various types of testing tools, including JMeter, Selenium, Gatling, and more. You can even provide your own Taurus YAML configuration file.
- Multi Test - You can run multiple Performance tests (multiple scripts) simultaneously by executing a Multi-Test. Each test (script) runs as a separate scenario within the Multi-Test. This can be especially useful for larger-scale situations and even allows for adding additional load while the test is running. Multi Test this is only available for pro subscription or higher.
- Recorder - This option provides you access to our Proxy Recorder, a tool for recording HTTP(s) actions you perform on a site. The recorder auto-generates a test script for you from that recording. Alternatively, record the test using our BlazeMeter Chrome Extension.
If you have the Functional tab selected, and click Create Test, you have the following options:
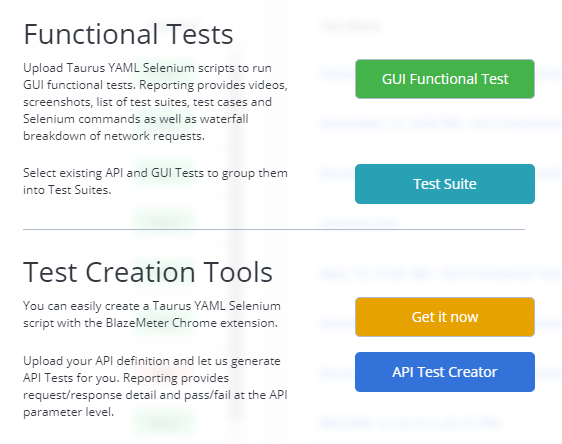
- GUI Functional Test - Test the functionality of your web application's graphical user interface (GUI). Upload an existing Selenium script, or easily record a Scriptless Test using our BlazeMeter Chrome Extension. It supports assertions, Service Virtualization, and Test Data.
- Test Suite - The same test case can be associated with several test suites.
Sign up now to one of our upcoming live webinars and learn about the latest tools and best practices.
