Calibrate a Taurus test
You may find that when you run a Performance test with a low number of threads (users), the test executes successfully, but once you begin scaling up to a higher load, the test fails or returns unexpected errors. This is often a sign that your test is in need of calibration, which must be performed to ensure a test will reliably run at higher loads.
This article offers some advice for calibrating a Taurus test for getting the best results in BlazeMeter. Taurus is an open-source test automation framework, which enables running 20+ open source testing tools, easily. For more information, see Creating a Taurus Test.
If you're instead running a JMeter test without a Taurus YAML, please refer to our Calibrating a JMeter Test guide.
Overview
- Create Your Script
- Test Locally with Taurus
- Create a BlazeMeter Test
- Run a Debug Test
- Determine Users per Engine
- Configure Your Full Load Test
- Use a Multi-Test for Multiple Scenarios
Step 1: Create your script
There are various ways to create your script, which include:
- Creating a new JMeter script via a Taurus YAML file. For details on how to do so, please refer to the Taurus article Creating a JMeter Script Using YAML.
- Creating a new YAML configuration file that references an existing script (such as a script from JMeter, Selenium, or Gatling). There is a list of articles about Learning Taurus that provide details on each option, such as How to Run an Existing JMeter Script.
- Using the BlazeMeter Proxy Recorder or BlazeMeter Chrome Extension to record your script.
If you generate a JMeter script from a recording, keep in mind that:
- You'll need to change certain parameters, such as username and password. You can also upload a CSV file with those test data values so each user can be unique.
- You might need to extract elements such as Token-String, Form-Build-Id and others, by using Regular Expressions, the JSON Path Extractor, or the XPath Extractor. This will enable you to complete requests like "AddToCart", "Login" and more.
- Keep your script parameterized and use configuration elements like HTTP Requests Defaults to make your life easier when switching between environments.
Step 2: Test locally with Taurus
Begin debugging your script with one thread and one iteration.
execution:
  concurrency: 1
  hold-for: 2m30s
  ramp-up: 1m
  iterations: 1
  scenario: Thread Group

scenarios:
  Thread Group:
    requests:
    - label: blazedemo
      method: GET
      url: http://blazedemo.com/
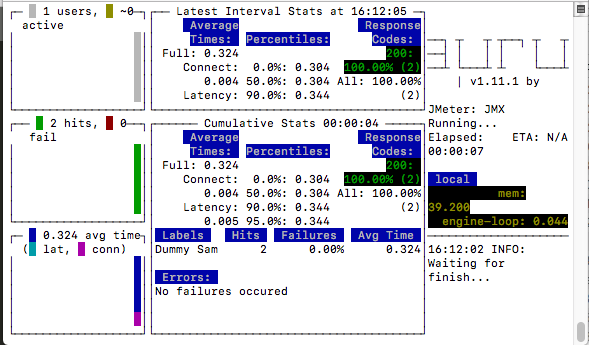
When the test is running, watch for any items that may be listed under the "Errors" section. Also monitor and be mindful of any irregularities with the "Connect" or "Latency" values.

After your local Taurus test completes, check the bzt.log and jmeter.log files that were generated for any errors or unexpected behavior.
You can examine test results in JMeter by opening the kpi.jtl file, which can be viewed via the "View Results Tree" listener. You can also view the JMX file that Taurus automatically created (if you created a new test via the YAML) or modified (if you ran an existing test via the YAML) by reviewing the JMX file the test generated.
After the script has run successfully using one thread, raise it to 0-20 threads for ten minutes and check:
-
Are the users coming up as unique (if this was your intention)?
-
Are you getting any errors?
-
If you're running a registration process, take a look at your backend. Are the accounts created according to your template? Are they unique?
-
Check test statistics under "Cumulative Stats". Do they make sense (in terms of average times, hits)?
Step 3: Create a BlazeMeter test
Now that your test is running successfully locally, you're ready to test it in the cloud! There are two ways you can run your Taurus test via BlazeMeter:
-
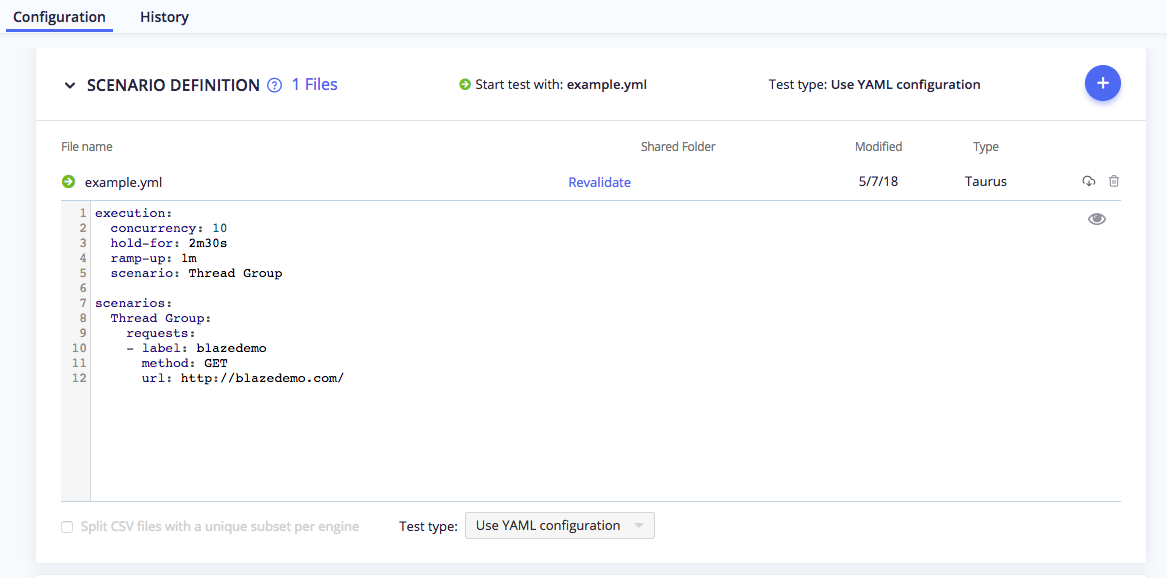
You can upload your test to BlazeMeter as described in our article Create a new Taurus test.
-
You can edit the YAML script to automatically run in the BlazeMeter cloud, as detailed in Scaling with cloud provisioning on the Taurus site.
Step 4: Run a debug test
Start with a Debug Test, which makes a logical copy of your test and runs it at a lower scale. The test will run with 10 threads and for a maximum of 5 minutes or 100 iterations, whichever occurs first.
This Debug configuration allows you to test your script and backend and ensure everything works well.
Here are some common issues you might come across:
-
Your firewall may block BlazeMeter's engines from reaching your application server. For more information, see Load Testing Behind Your Corporate Firewall.
-
Make sure all of your test files (CSVs, JARs, JSON, user.properties, etc.) are uploaded to the test. For more information, see Uploading Files & Shared Folders.
-
Make sure you didn't use any paths with your file names.
If you're still having trouble, look at the Errors Report and Logs Report for errors. This will allow you to get enough data to analyze the results and ensure the script was executed as you expected.
You should also check the Engine Health Report to see how much memory and CPU was used, which is key to the next step.
Lastly, keep an eye out for common issues that may result in your test running locally but not on BlazeMeter or your test not starting at all.
Step 5: Determine users per engine
Now that we're sure the script runs flawlessly in BlazeMeter, we need to figure out how many users we can apply to one engine. (For details on how to configure users per engine in Taurus, please refer to the article Load settings for cloud.)
Set your test configuration to:
-
Concurrency: 500
-
Ramp-up: 40 minutes
-
Hold-for: 50 minutes
-
Do not use any local engines
-
Use 1 cloud engine
Run the test and monitor your test's engine via the Engine health report.
execution:
  concurrency: 300
  hold-for: 5m
  ramp-up: 15m
  scenario: Thread Group
  locations:
  us-east-1: 1

scenarios:
  Thread Group:
    requests:
      - label: blazedemo
		method: GET
        url: http://blazedemo.com/
If your engine didn't reach either a 75% CPU utilization or 85% memory usage (one time peaks can be ignored), then:
-
Change the number of threads to 700 and run the test again
-
Raise the number of threads until you get to 1,000 threads or 60% CPU
If your engine passed the 75% CPU utilization or 85% Memory usage (one time peaks can be ignored) then:
-
Look at when your test first got to 75% and see how many users you had at this point.
-
Run the test again. This time, decrease the threads per engine by 10%.
-
Set the ramp-up time you want for the real test (5-15 minutes is a great start) and set the duration to 50 minutes.
-
Make sure you don't go over 75% CPU or 85% memory usage throughout the test
Step 6: Configure your full load test
With your calibration testing complete, you're now ready to run your real test! Now you can:
-
Configure the actual amount of users you require.
-
Set the number of engines you need for handling the load.
Ensure you keep the users per engine the same as your final successful result in your calibration tests from Step 3.
Consider the following example, where we run a 1,000-user test using five engines:
execution:
  concurrency: 1000
  hold-for: 2h
  ramp-up: 30m
  scenario: Thread Group
  locations:
    us-east-1: 2
    us-west-1: 3

scenarios:
  Thread Group:
    requests:
      - label: blazedemo
      method: GET
      url: http://blazedemo.com/
Once you're ready, press the Run Test button.
Step 7: Use a multi-test for multiple scenarios
This step is optional and only applies if your test includes multiple scenarios, in which case you should set up your test as a Multi-Test via the web UI. (For a detailed walkthrough, refer to our guide on Multi-Tests.)
-
Create a new Multi-Test.
-
Add each single test.
-
You can change the configuration of each scenario as detailed in the Modify the Scenarios section of our Multi-Test guide.
-
Click Run Test to launch all of your scenarios. Additional options are covered in the Run the Multi-Test section of our Multi-Test guide.
The aggregated report of your Multi Test will start generating results in a few minutes, which also can be filtered for each individual scenario. For more information about how to use these filters, refer to our Reporting Selectors for Scenario and Location guide.
