Run a Performance test
- Run a Performance test for the first time
- Run a Performance test repeatedly
- Boot screen summary
- Detailed boot status screen
- System log
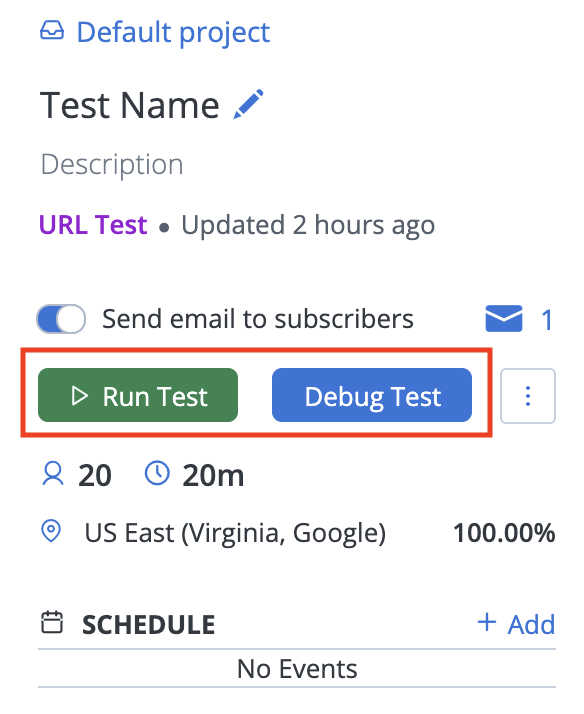
You created your performance test and you are ready to run the test. From the test configuration view, you can run the test by:
- Clicking the Run Test button to run a full Performance Test.
- Clicking the Debug Test button to run a low-scale Debug Test with enhanced logging.
Run a Performance test for the first time
Follow these steps:
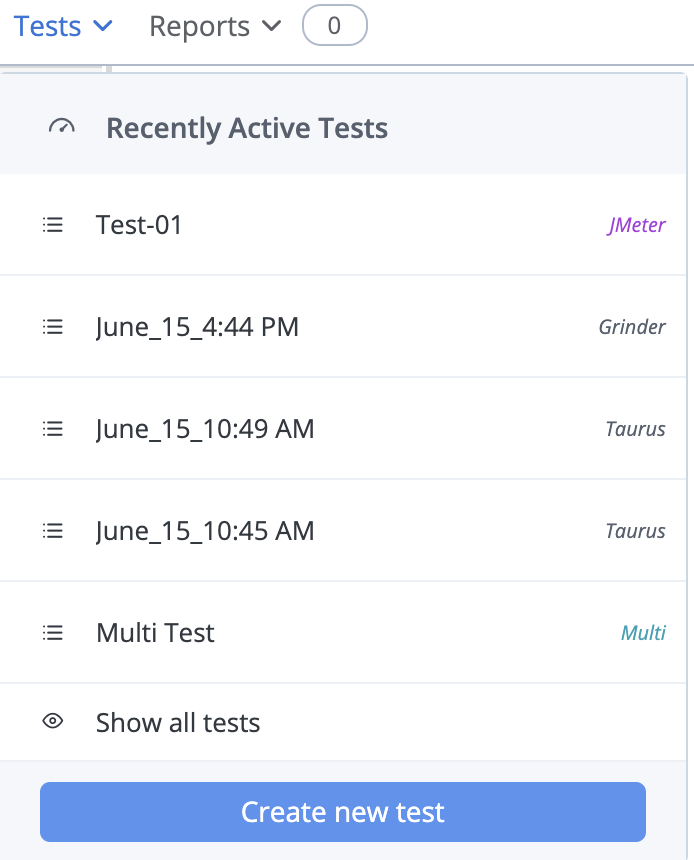
- In Performance tab, click Tests.
- Select the test from the list of recently active tests.
A Launch Test window opens.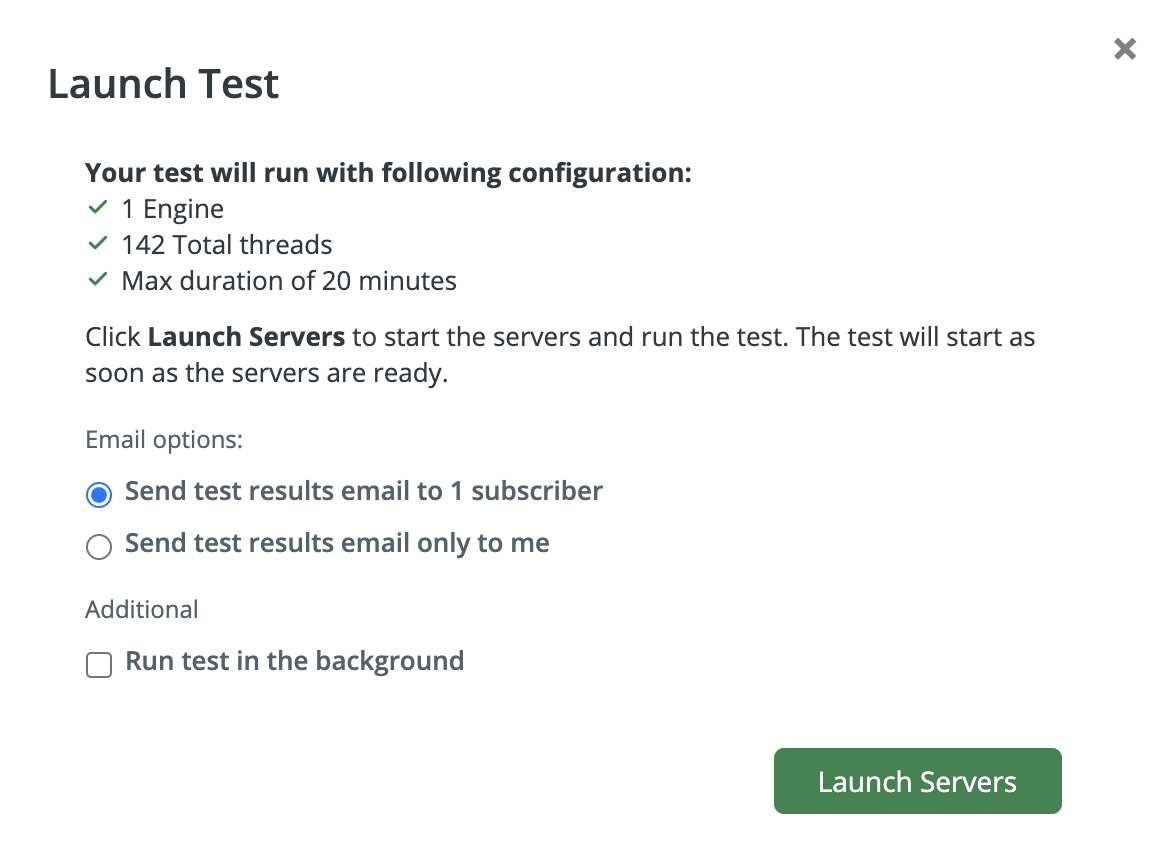
-
Review the configuration and click Launch Servers to start the test.
-
Select the email options for sending test results.
-
(Optional): Check the Run test in the background box if you do not want to see the startup status view. You will be returned to your previous view and the test runs in the background. Next to the Reports drop-down list, you can see a number of currently running tests.
 If two or more locations are configured, you will also see a Synchronized Start checkbox. This ensures that all servers are up before starting the test. Select this option if you have a concern that some servers or locations are significantly slower than others and you wish to synchronize them.
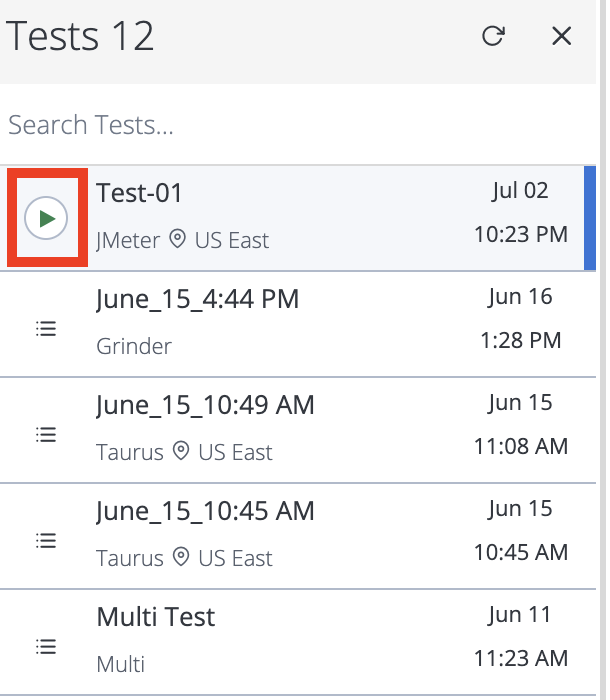
Run a Performance test repeatedly
Follow these steps:
- In Performance tab, click Tests.
- Click Show all tests.
A list of all tests opens as a column on the left.Only tests that have been previously run show in the list of recently active tests. - Click the play button next to the test that you want to run.
A Launch Test window opens. -
Review the configuration and click Launch Servers to start the test.
-
Select the email options for sending test results.
-
(Optional): Check the Run test in the background box if you do not want to see the startup status view. You will be returned to your previous view and the test runs in the background. Next to the Reports drop-down list, you can see a number of currently running tests.
To abort the test, click the Abort Test button in the top right corner. For more information, see Stopping a Test.
Review the boot screen summary
If you did not check the Run test in the background option, you will see the boot status of the engine(s) of your test:
- Pending
Indicates the percentage of engines are pending allocation on our end.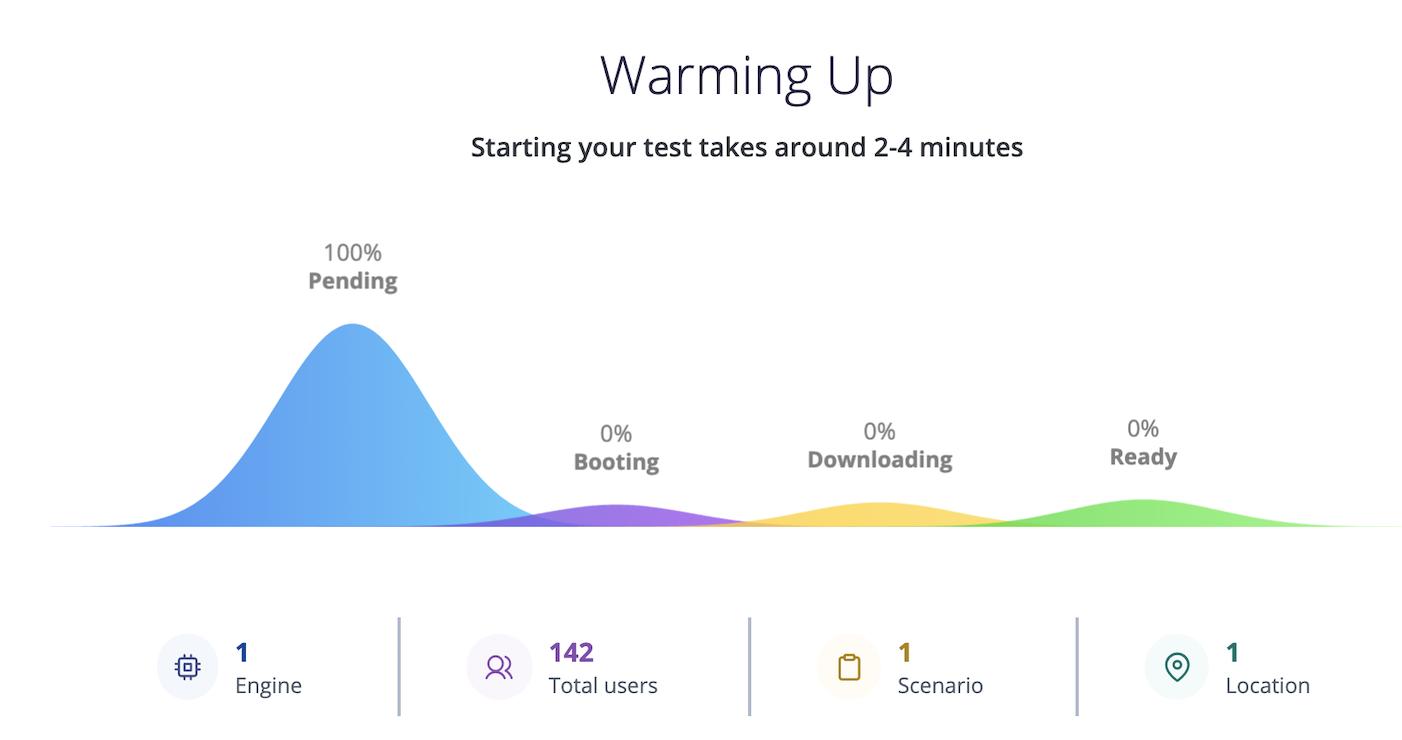
- Booting
Indicates the percentage of engines that have been allocated and are booting up.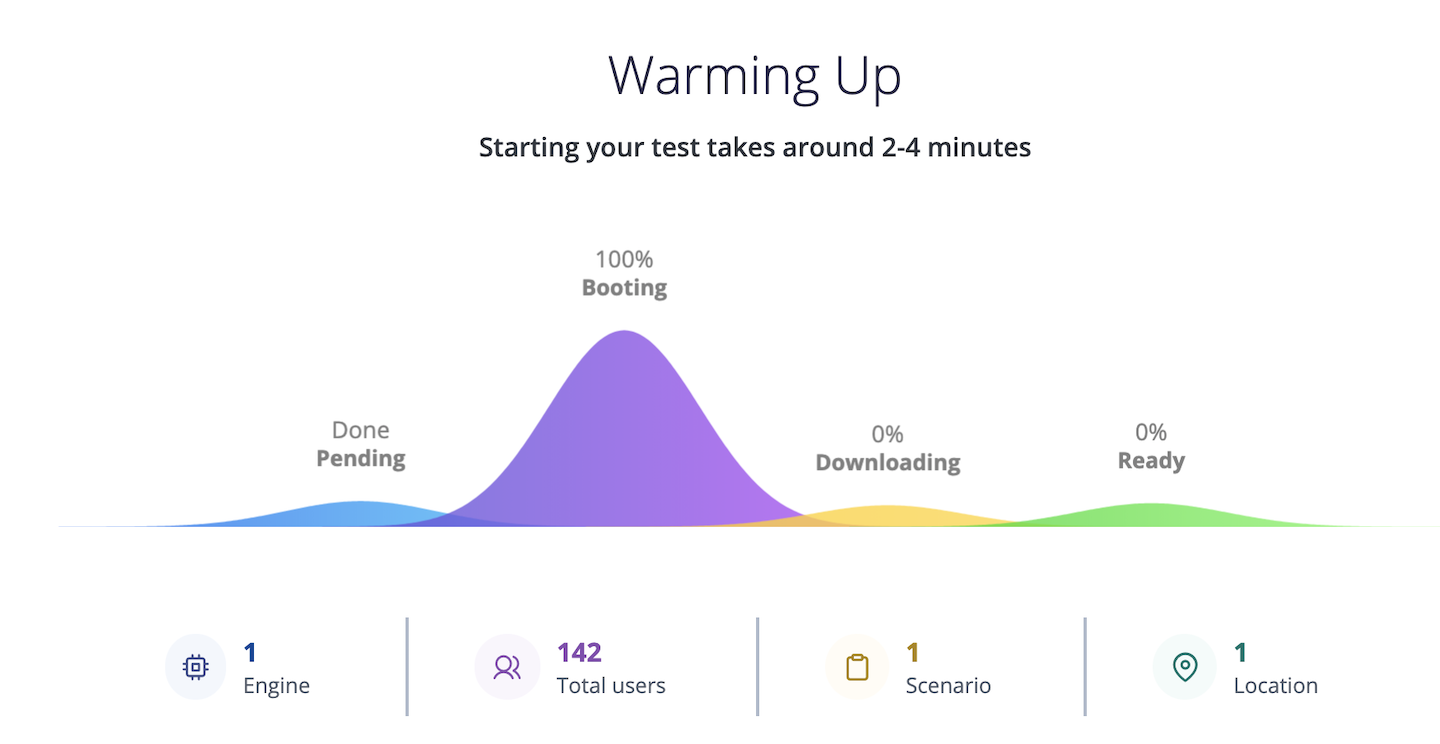
- Downloading
Indicates the percentage of engines that have started downloading all the test assets.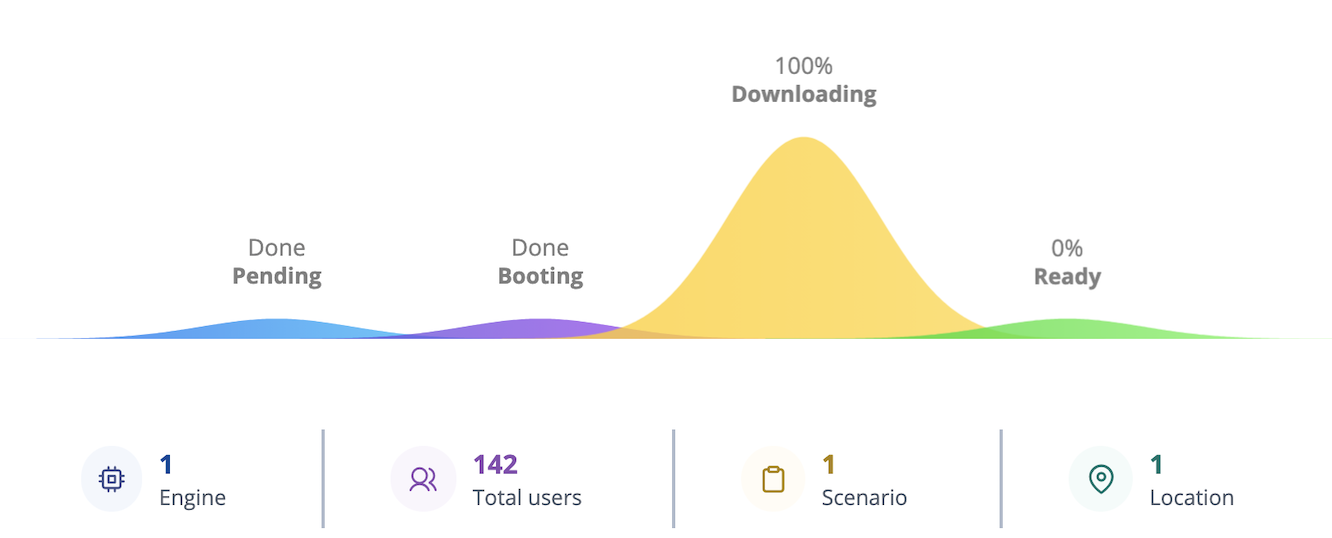
- Ready
Indicates the percentage of engines that are ready to start.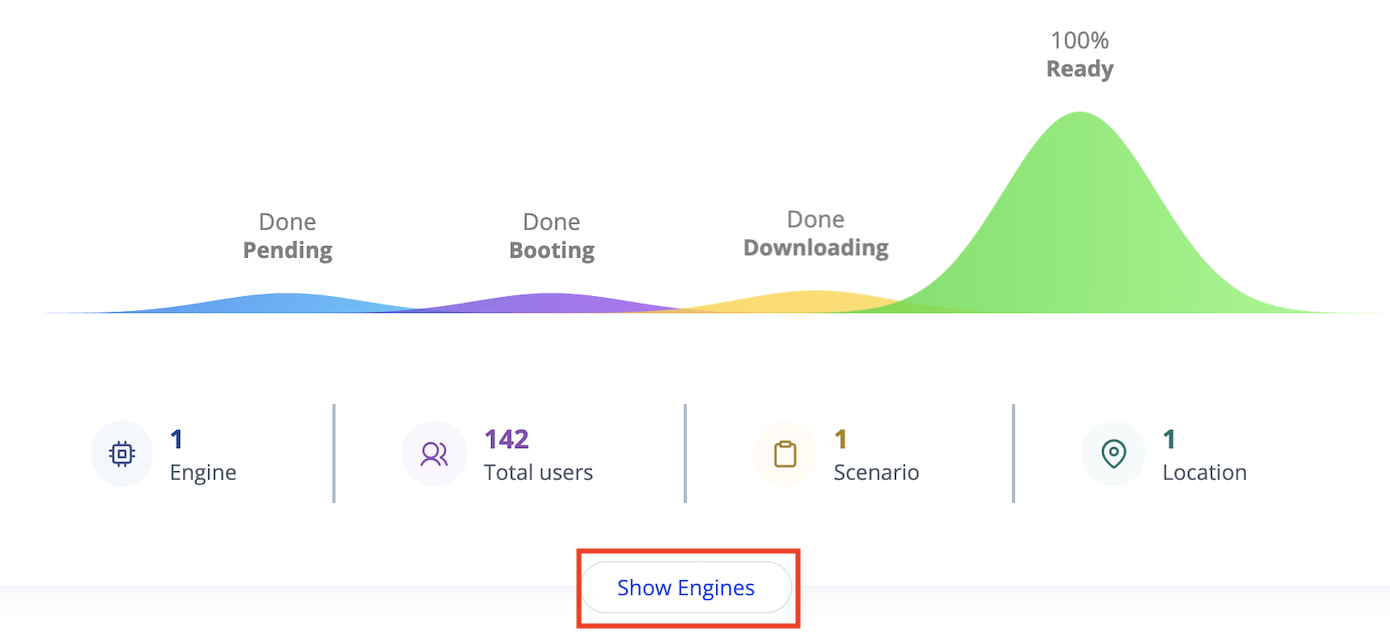
If you want to get more detailed information on your engines and their statuses, click the Show Engines button.
Review the detailed boot status screen
When you click the Show Engines button, you will see a detailed screen with a more detailed breakdown of the engines running:
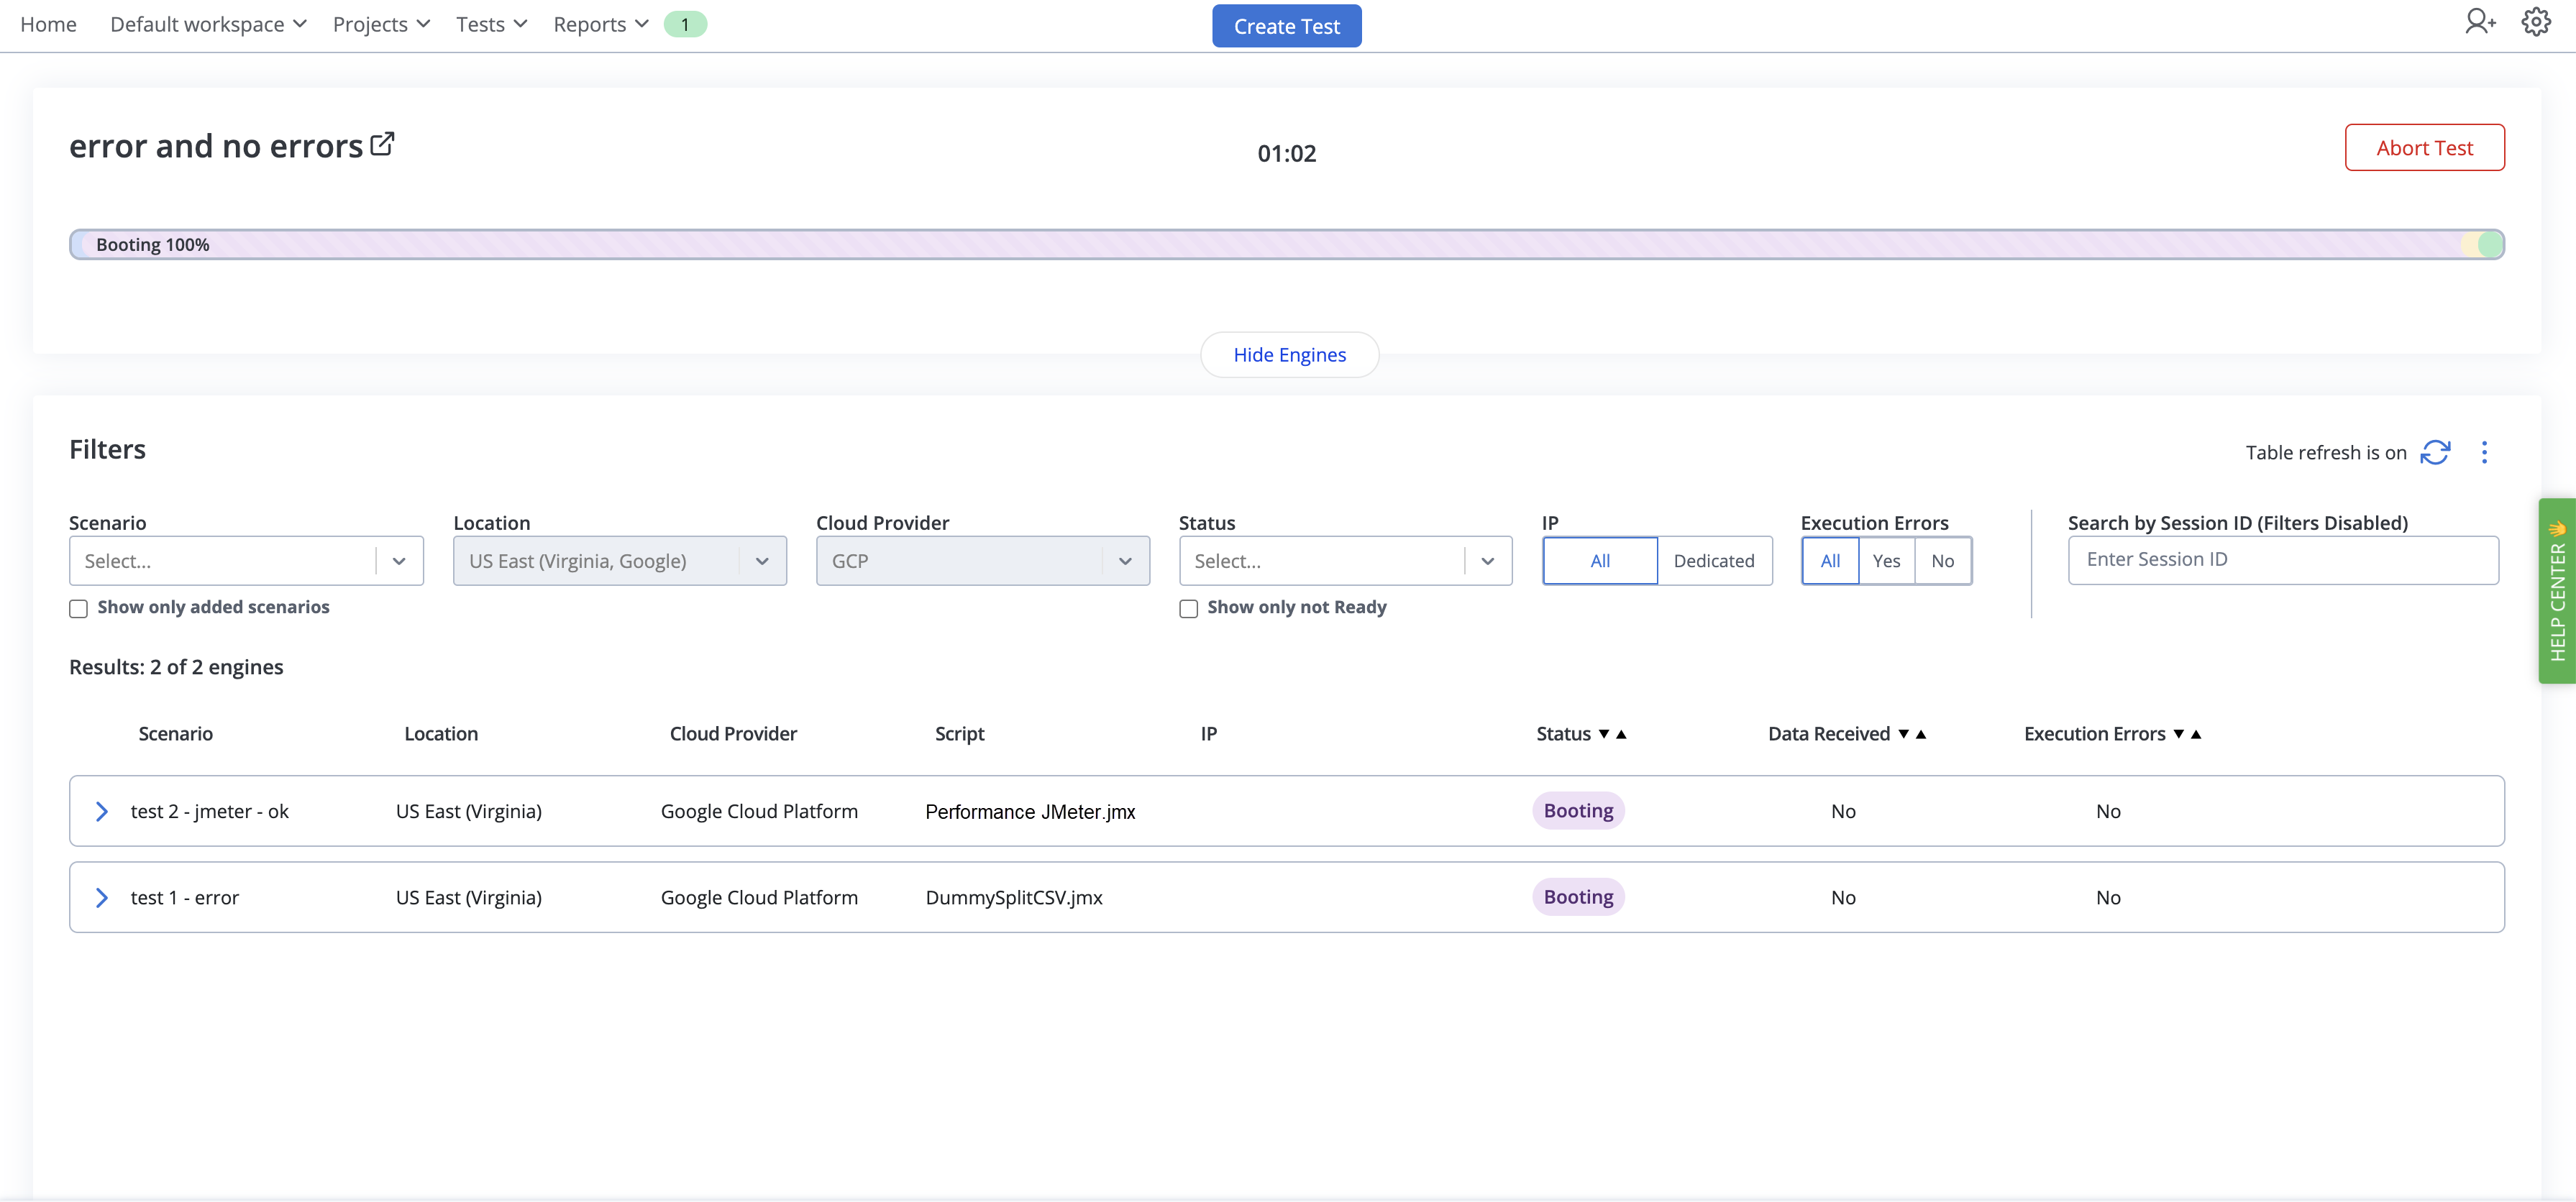
- Name of the test with the link to the test configuration for this test run.
- The amount of time that has occurred since the start of the test run.
- Hide Engines
Returns the screen to the summary view described above. - Force Start
Force starts the test without waiting for the rest of the engines to be in Ready status. - Start Test
Starts the test. Appears when all engines are in Ready status. - Abort Test
Terminates the test, stopping all engines immediately upon confirmation. - Table refresh is on
Set the refresh rate of the table.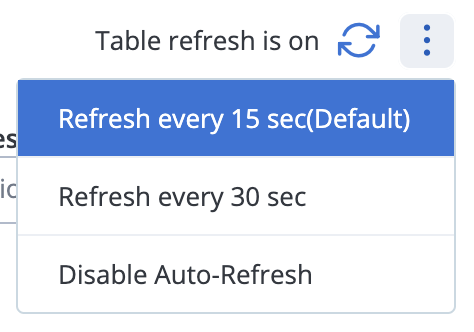
- Scenario drop-down list
Filter the engines by scenario. The Show only added scenarios option shows only the scenarios you added to a test using this feature. - Location drop-down list
Filter the engines by location. - Cloud Provider drop-down list
Filter the engines by the cloud provider (AWS, Google Cloud, Azure, and Private Locations). - Status drop-down list
Filter the engines by status. The Show only not Ready option selects all options except for the Ready status. You will only see engines that are NOT in Ready status. - Search by Session ID
Enter a session ID of one of the running engines to focus on just that engine. - IP
Filter the engines that use dedicated IPs or all engines. - Show log
Opens the system log for that specific machine. For more information, see System Log.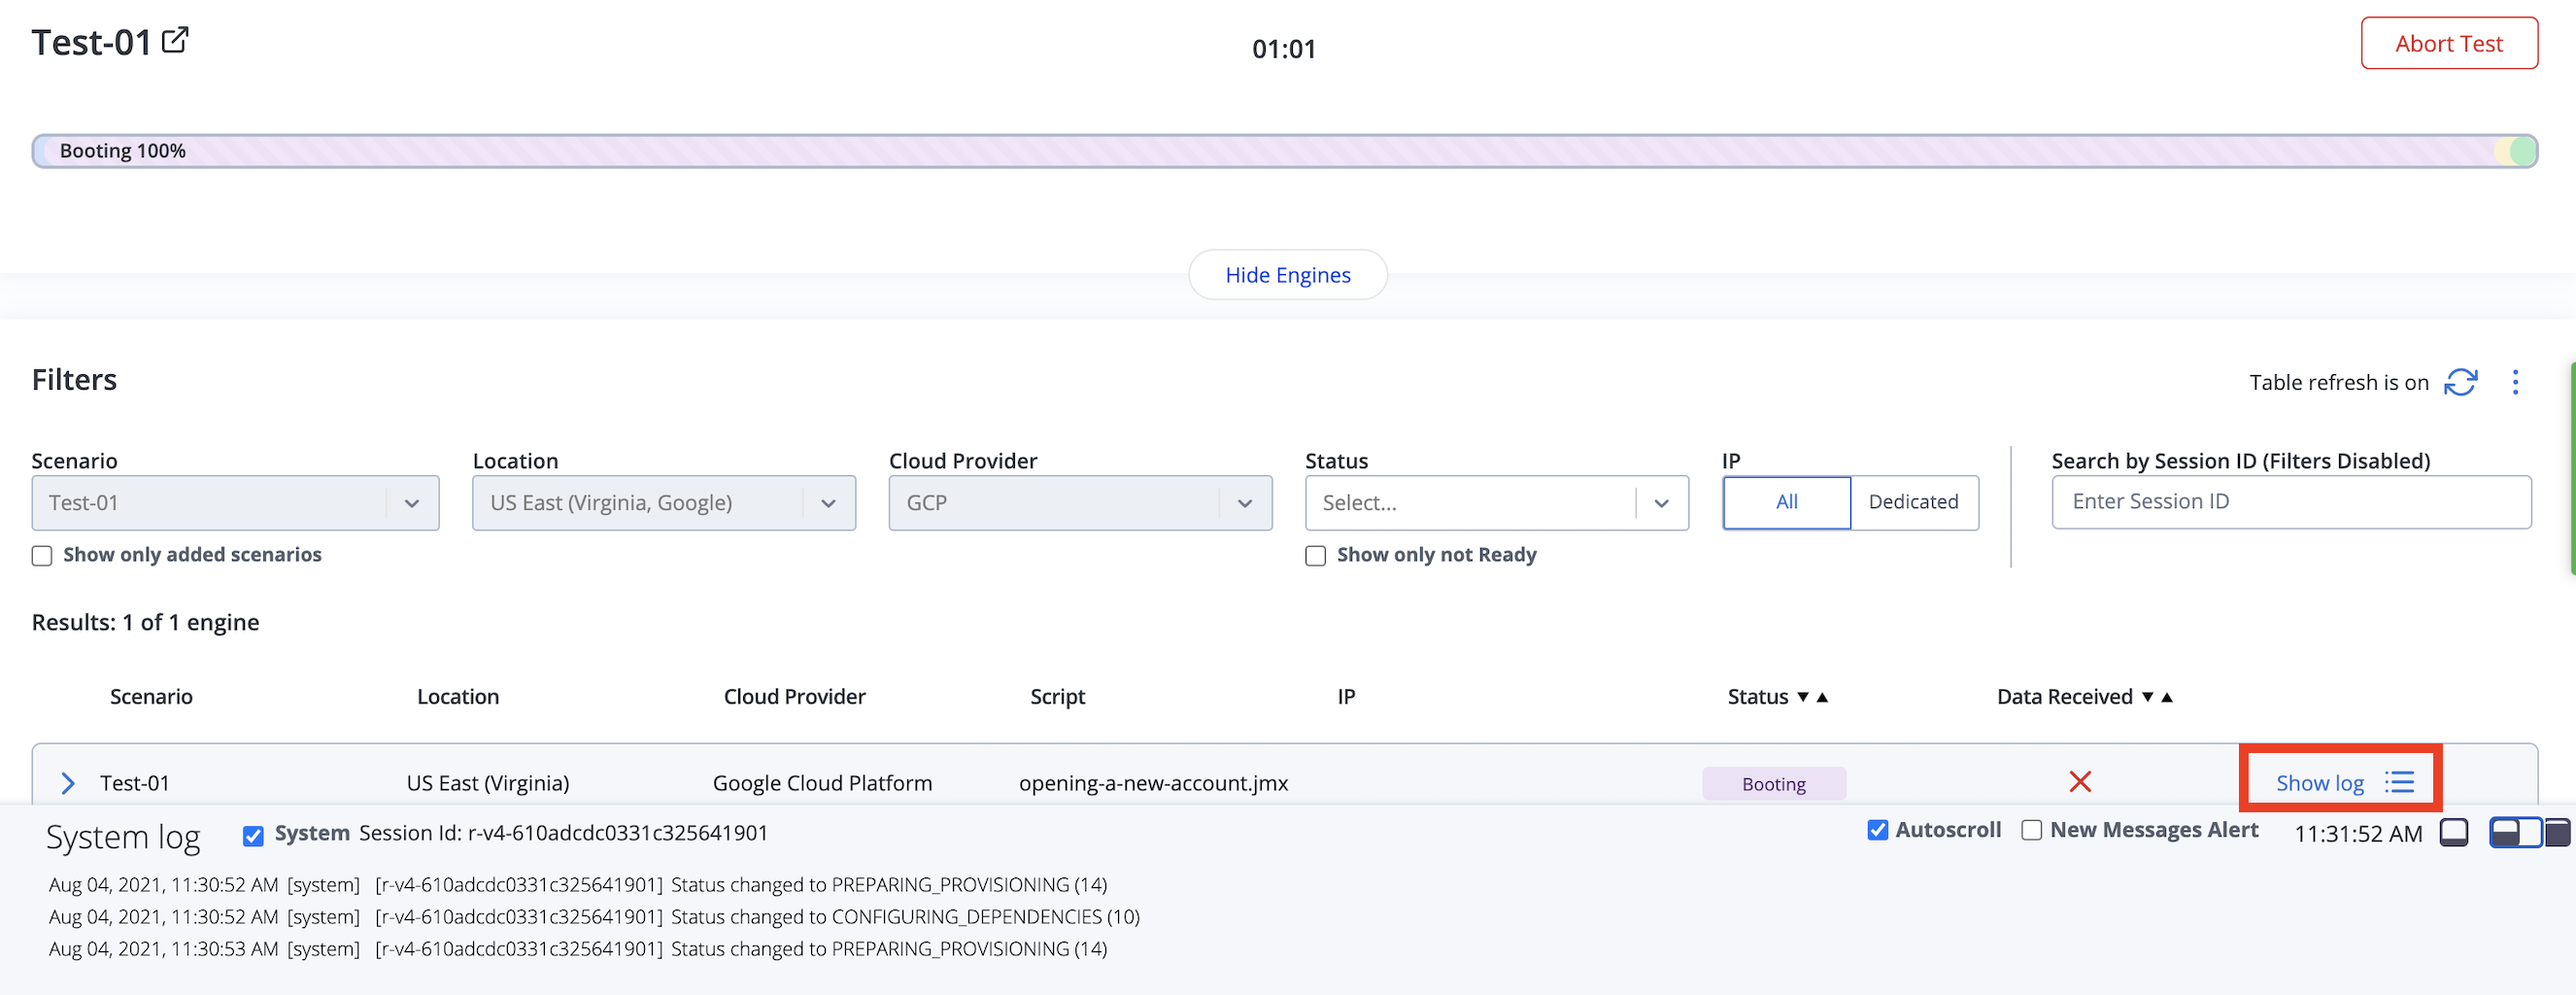
For each engine in your test, you can see the following information:
- Scenario - The scenario this engine is running.
- Location - The cloud or private location where this engine is running.
- Cloud Provider - The name of the cloud provider where this engine is running.
- Script - The script this engine is starting with.
- IP - The IP address of this engine.
- Status - The status the engine is currently in.
- Session Id - The sessionId for this engine.
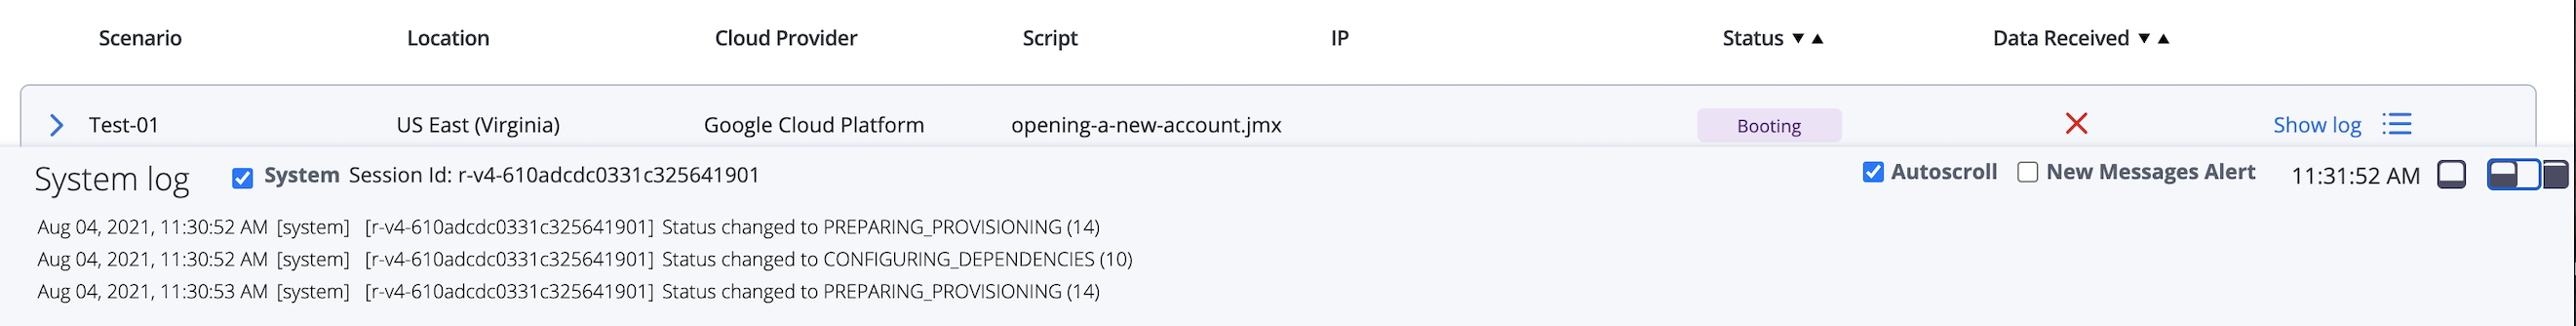
System log
To see the system log, click the boxes in the bottom right corner.

To be able to see the boxes, you must select location first.
System Log checkboxes:
- System - Ensures system messages are included in the log.
- User - Shows the user logs form the system log.
- Autoscroll - Ensures the window automatically scrolls as new lines fill it up.
- New Messages Alert - Provides notifications for every new action.
You can complete other tasks while the test is running in the background, such as viewing reports or configuring and running other tests.
You can wait a few minutes until the test ends or you can stop the test yourself. If you need to manually stop the test for any reason, see Stopping a Test.
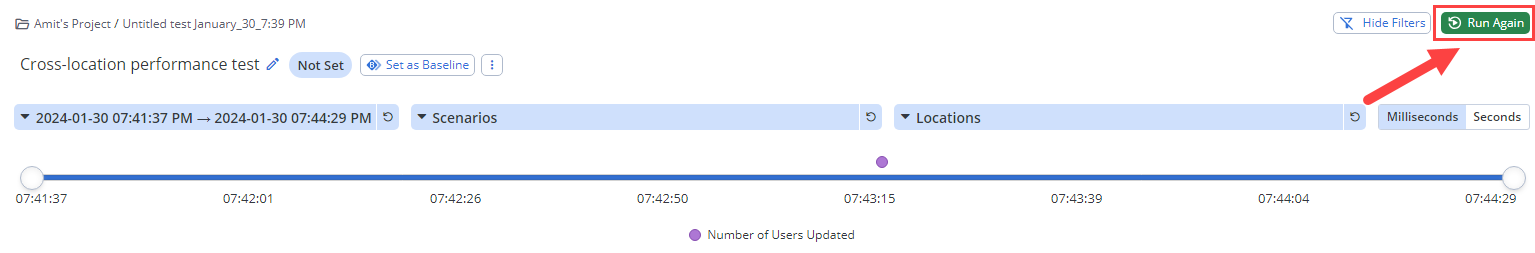
Rerun tests from reports
You can re-execute tests from the report header area. This functionality is particularly useful for conducting iterative testing, verifying fixes, or comparing performance metrics over time.
Rerunning performance tests in BlazeMeter helps you continuously assess and enhance the performance of your applications. During the rerun, you can monitor the progress of the test execution in real-time through the BlazeMeter user interface. You can track metrics such as response times, error rates, and system resource utilization to gauge the performance of the application under test.
After the rerun completes, you can analyze the test results to identify any performance issues, trends, or improvements compared to previous runs.
Based on the insights gained from the rerun, you can choose to iterate on your test scenarios, make adjustments to the application code, or implement performance optimizations before initiating subsequent reruns.
Steps
-
From the Performance tab, click Reports and select the required test from the list of available tests.
-
(Optional) Before rerunning the test, modify test parameters such as number of users, duration, location, or scenario configuration to suit your testing requirements.
-
When satisfied with the test setup, click Run Again to initiate the rerun process.