Radar agent overview
The Radar Agent bridges BlazeMeter API Monitoring to private APIs not available over the public internet. By running the agent within your infrastructure, BlazeMeter API monitors can run against endpoints that are otherwise inaccessible to the cloud agents. The agent is particularly useful if you are looking to test or monitor an API in the following situations:
- Monitoring private or internal APIs that reside behind a firewall.For Radar Agents to function properly, you need to allow two types of network access through your firewall: access to api.runscope.com, and access to any endpoints your tests are targeting.
- Testing APIs on localhost or in a private staging environment.
- Accessing APIs that require a fixed client IP address (IP allowlisting).
Use of the agent requires a trial or paid subscription.
A Radar Agent is a wholly separate installation apart from a Private Location. Private Location serves as an on-premise agent for running Functional Tests or Performance Tests. The Radar Agent serves as an on-premise agent for running API Monitoring tests.
- How it works
- Downloading and running the agent
- Using the agent for test runs
- Command line / Configuration file reference
- Troubleshooting
How it works
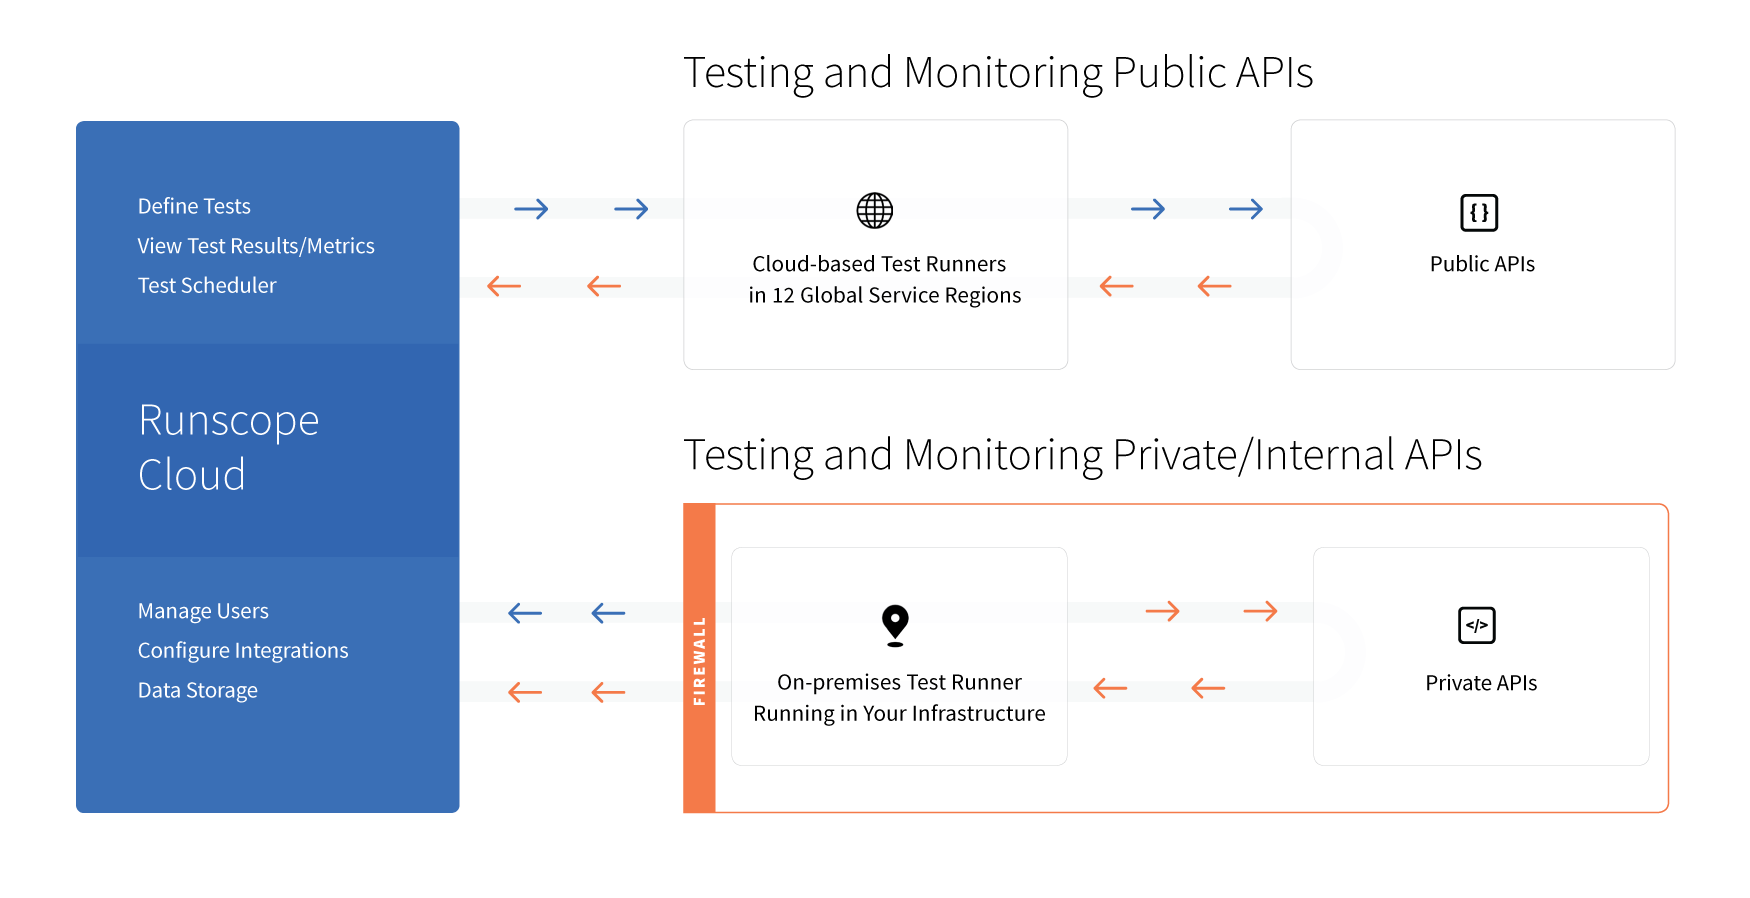
Monitoring and testing private APIs with API Monitoring uses a hybrid on-premises approach. The agent runs on a host within your infrastructure but test data is managed and stored in the BlazeMeter cloud. Using the API Monitoring dashboard, you have a single interface for defining tests, viewing results, configuring notifications and enabling 3rd-party integrations.
All communication from the agent to the BlazeMeter cloud is made over outbound requests to the BlazeMeter API via HTTPS on port 443. The agent requests work to be processed and sends back results over a TLS-encrypted connection and is not externally addressable.
Download the agent
Select an operating system to download the latest agent:
For information on previous releases, see Radar Agent Changelog.
Recommended requirements
As a general guideline, we recommend a machine with:
- 4-core CPUs or higher
- 4GB RAM or higher
Run the agent
After downloading the agent, extract the executable from the .zip file so that you can run it from your command line.
--token flag to ensure the agent authenticates with an API Monitoring token.If you do not yet have a token, follow these steps to create one:
- Log in to BlazeMeter and navigate to the API Monitoring tab.
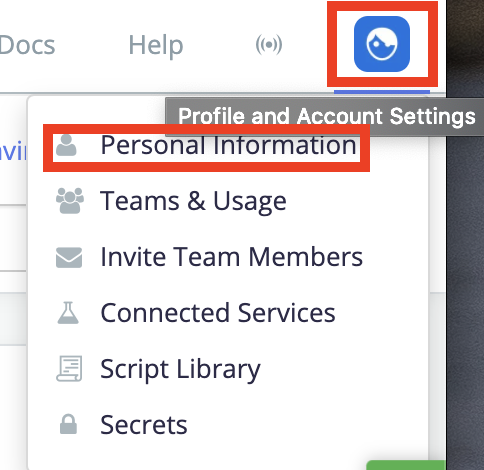
- Click the Profile and Account Settings icon in the top right corner.
- From the drop-down list, select Personal Information.

- In the menu on the left, click Applications.
-
Click Create Application.
- Name your app. You do not necessarily need a real application, as this app may simply serve as a placeholder for generating your token, so consider naming for example "API Monitoring Agent Token".
- The app requires a website URL and callback URL. Since this can be a placeholder app, you may enter any URL you like, even completely imaginary URLs.
- Click Create Application.
- On the next page, scroll down to view your new Personal Access Token.
You may wonder why it is necessary to create a new application. The API Monitoring feature typically requires a token be associated with an application for general use cases, but in this context, we simply need a token to authenticate the agent with, so creating a fake "dummy" application in order to generate one will suffice.
Once you have a token, run your agent for the first time:
Linux and macOS
$ ./runscope-radar --token=your_personal_access_token
Windows
C:\> runscope-radar.exe --token=your_personal_access_token
If you are a member of multiple API Monitoring teams, then you will next be prompted to select which team to associate your new agent with.
Once authenticated, you can save a configuration file to be used for subsequent runs of the agent (without having to pass your token each time). To launch the agent with a specific configuration file, use the -f command line option. This is the recommended way to start the agent.
Linux and macOS
$ ./runscope-radar -f radar.conf
Windows
C:\> runscope-radar.exe -f radar.conf
If you examine the contents of this configuration file, you will find that it contains various parameters, including the API token you provided earlier, along with a unique Agent ID and the Team ID the agent is associated with.
With the agent running, you're now ready to use it for your tests.
Using the agent for test runs
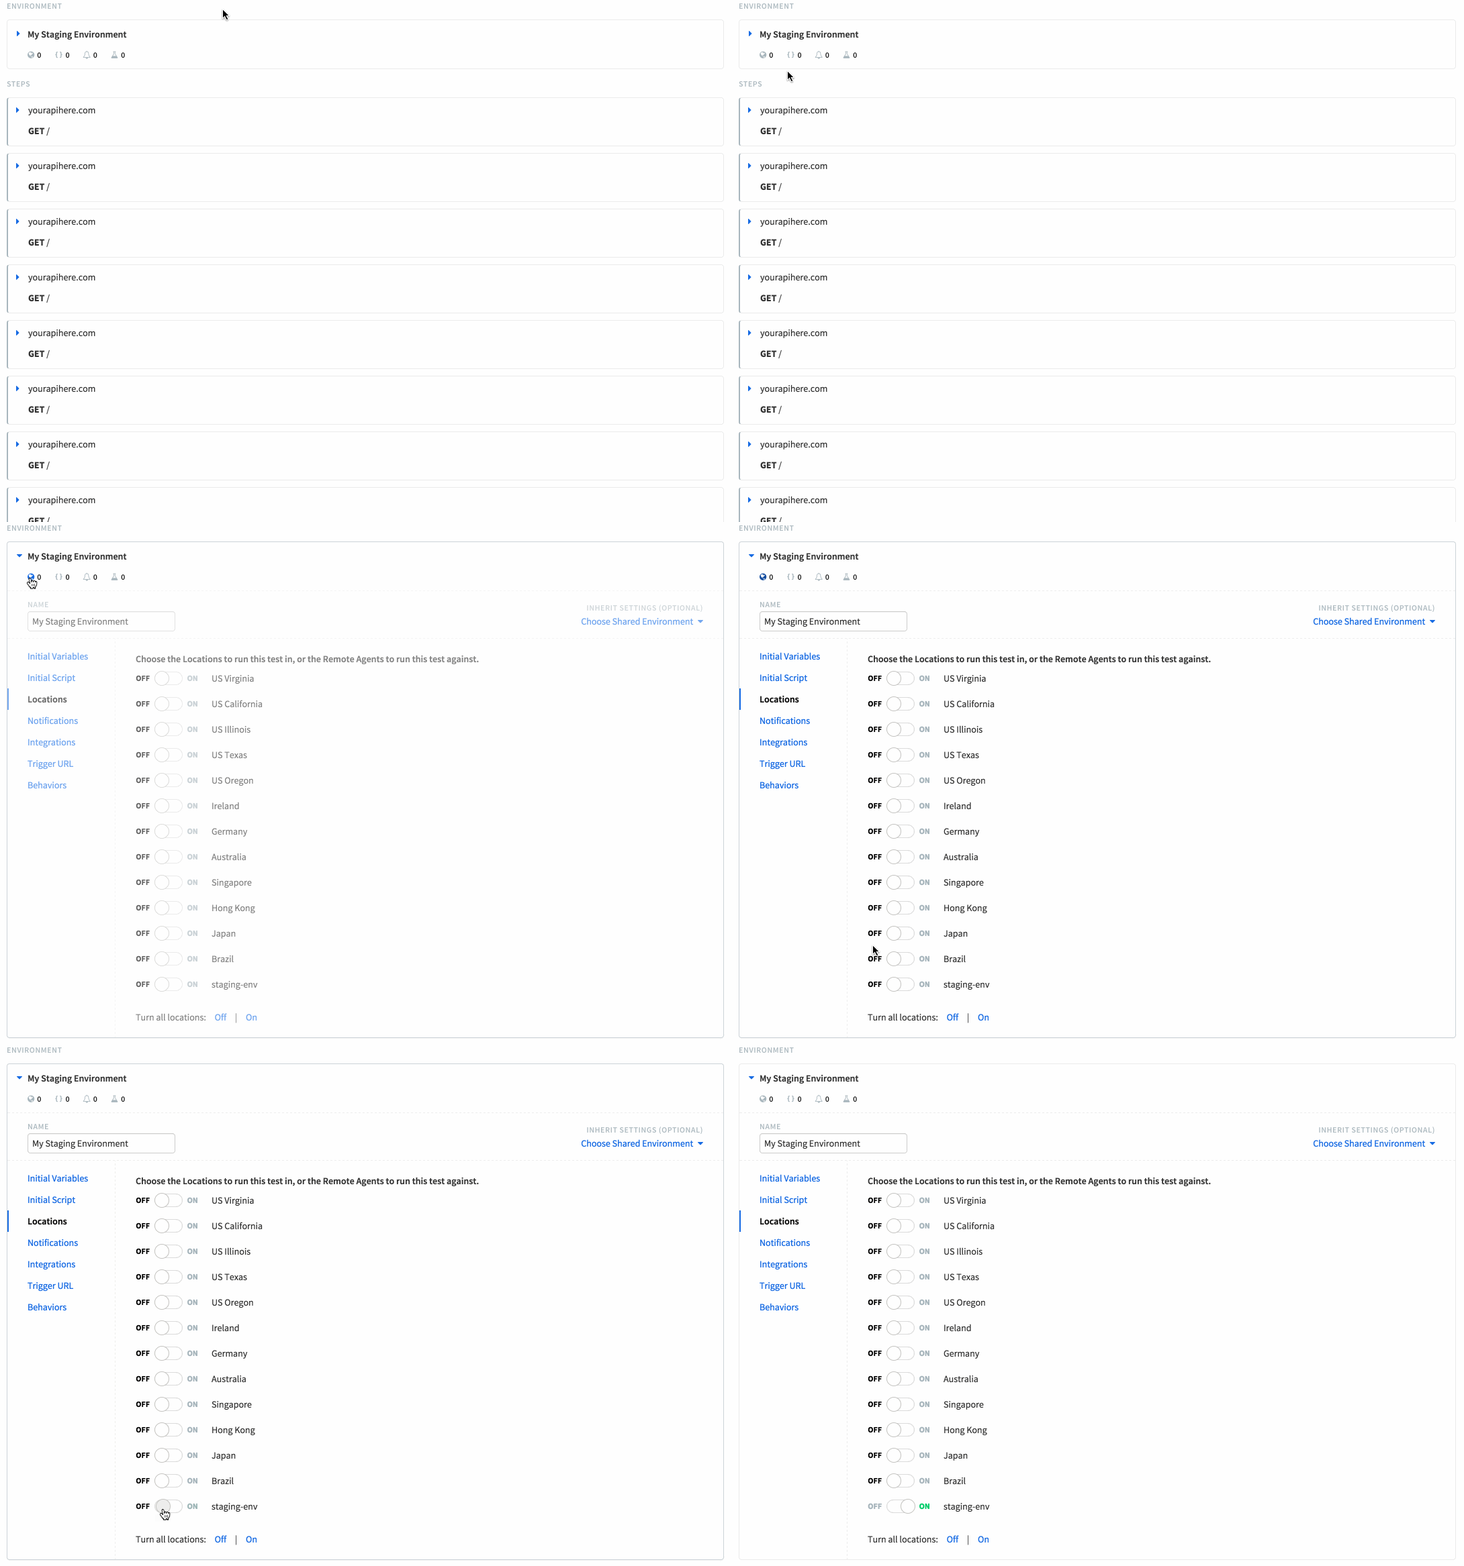
After downloading and launching the agent, head over to the API test editor for the test you want to use the agent for. If everything is working correctly, the agent will appear as an option in the Locations section of the environment settings:
If you are testing an API across multiple realms (for example local, staging, prod), you may want to selectively enable the agent per-environment. The agent can also be enabled in a shared environment used across tests within a single bucket.
Command line flags / Configuration file reference
You can specify the following parameters in your configuration file, or on the command line, when executing the agent. The configuration file will override the same parameters used in the command line.
--agent-id
|
string | Agent UUID. |
--api-host
|
string | API host base URL. |
--cafile
|
string | CA certificate file. |
--cert
|
string | Client certificate file (PEM-encoded) for two-way HTTPS authentication. |
-f, --configfile
|
string | Start the agent with the configuration contained within the specified configuration file. |
--debug
|
Enable debugging web server. | |
--disable-dns-lookup
|
boolean | Default is "false" (DNS pre-checks enabled). Set to "true" to disable DNS pre-checks. |
--disconnect-timeout
|
string | Disconnect timeout. Default: "5". |
-h, --help
|
Show all available flags. Only works on the cli. | |
--ignore-env-proxy
|
Ignore HTTP_PROXY and HTTPS_PROXY environment variables. Requests to api.runscope.com will still use the proxy. | |
--key
|
string | Client key file (PEM-encoded) for two-way HTTPS authentication. |
-l, --logfile
|
string | Write logfile to an external file. |
--name
|
string | The name of the agent to be displayed in the API Monitoring UI Locations menu. |
--pass
|
string | Passphrase for client key file. |
--pidfile
|
string | Pidfile. |
--private
|
boolean |
Set the Radar agent to be only visible to user that created it. When set to true, the Radar agent will appear in a “read-only” mode to every other user when editing locations in a test environment, and only the user that created the Radar agent can enable or disable it within a test environment. The default is false, meaning that the Radar agent is visible to every user in the team that the agent is associated with. |
--team-id
|
string | Team UUID. |
--threads
|
integer | Number of worker threads. Default: 10. |
--timeout
|
integer | Connection idle timeout. Default: 20. |
-t, --token
|
string | API Monitoring Auth Token. |
-v, --verbose
|
Log more information. | |
--verify-ssl
|
boolean | Verify SSL. |
--version
|
Get version number. Only works on the cli. | |
--web-host
|
string | Web host base url. Default: https://www.runscope.com. |
Examples
Running the agent in verbose mode, and ignoring env proxy variables:
$ ./runscope-radar -f radar.conf -v --ignore-env-proxy
Configuration file with increased threads value to support a higher amount of requests, and ignoring environment proxy variables:
api-host=https://api.runscope.com
threads=50
agent-id=your_agent_id
team-id=your_team_id
name=internal-1.local
timeout=20
disconnect-timeout=5
cafile=
token=your_runscope_token
ignore-env-proxy
Troubleshooting
In the event that the Radar Agent is down or otherwise not available for any reason, BlazeMeter will expire any test executing on it and immediately set a status of "Remote Agent Expired" so that the user is alerted to the problem. Automated email and/or Slack notifications may be sent as well. Please refer to the Handling Radar Agent Availability Issues guide for our recommended best practices.
All tests marked with the "Remote Agent Expired" status will be colored orange in the Dashboard, Latest Test Results, and Test Result progress bars in the GUI.
While an on-premise Radar Agent is down and until said agent comes back up (is available again), no scheduled test that tries to run on it will count toward any metrics calculation, nor will it count toward the owning team's test count.
If you run into any issues while setting up or running the agent, such as difficulty connecting to api.runscope.com, or intermittent test errors, check out the following troubleshooting articles:


