BlazeMeter interface
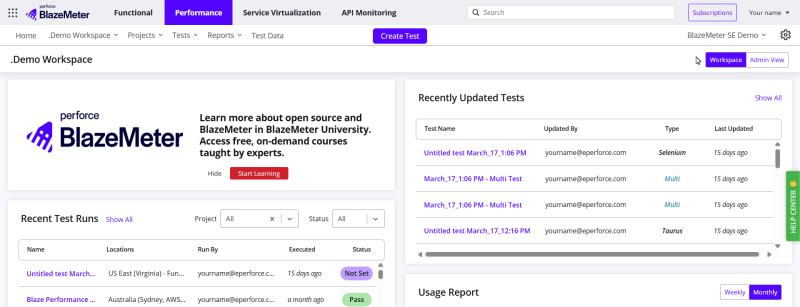
The Blaze Meter interface is made up of the navigation panel and the dashboard. The dashboard contains information about your tests. The navigation bar is made up of two rows. The top row features a selection of tabs to select the BlazeMeter service you want to use. The second row features a number of navigation menu items. The right side of the navigation menu is where you can manage your account settings.
Navigation bar: row one
The first row of the navigation bar includes these tabs:
-
Functional—When this tab is selected, only items relating to functional tests are available. The Create Test button only provides Functional test options, and only Functional tests and their reports are visible.
-
Performance—When this tab is selected, only items relating to Performance tests are available. The Create Test button only provides Performance test options, and only Performance tests and their reports are visible. (The Performance tab is the default tab selection.)
-
Service Virtualization—You can use a virtual service as a "stand-in" or substitute for a service that your test depends on. This feature allows you to test even when you don't have access to a full test environment.
-
API Monitoring—You can monitor public, private, and third-party APIs, as well as evaluate the uptime, performance, and correctness of an API via API tests.
-
Search—You can use the search field in the BlazeMeter header to search for tests and reports by name. The search field is only visible when the Performance or Functional tabs are selected.
Navigation bar: row two
What you see in the second row of the navigation menu is based on the feature you have selected in the first row.
When the Functional or Performance tab is selected:
-
Home—Return to the home page.
-
Workspace—Lists all the workspaces you own or are a member of. If you have more than one account, it lists the workspaces you are a member/owner of for the currently selected account.
-
Projects—View your recently visited projects within the workspace you are currently viewing. To open a sidebar with the entire list of projects, click Show all projects.
-
Tests—View your recently visited tests. To open a sidebar with the entire list of tests you have in the current workspace, click Show all tests.
-
Reports—View a list of your recently visited test reports. To open a sidebar with the entire list of reports you have in the current workspace, click Show all reports.
-
Active Runs—Displays the number of tests currently active. Hover over this number to see a breakdown of how many tests are currently running in the current workspace and how many are running across all workspaces.
-
Create Test—Create a test of the test type you have selected. You can use a recorder to create tests.
When the Service Virtualization tab is selected:
- Virtual Services—View a list of available virtual services, Virtual Service groups, and Virtual Service templates.
- Asset Catalog—Use the Asset Catalog as a single place to store transactions and to find and view any available virtual service.
- Analytics—View analytics for virtual services. To better understand usage and behavior of a particular virtual service and to troubleshoot performance or matching issues, use Analytics for access to reporting, inspection and tracking data. For more information, see Analytics for Transaction Virtual Services.
- Learn More—Click this tab for additional resources on virtual service and continuous testing.
Virtual services can be used stand-alone as look-up services, or to amend other test types. For more information, see the Service Virtualization documentation.
Click the API Monitoring tab to go to the API Monitoring UI. For more information, see the API Monitoring documentation.
Navigation bar: Right-side menus
The right side of the navigation bar contains menus related to your settings and account. These settings include:
- Personal Settings—Create your API Key, change your password, change your default test location, or choose a different time zone.
- Account Settings—Manage users, workspaces, billing, and more.
- Workspace Settings—Manage team sharing, external connections, and which users work in which workspaces.