Introduction to Performance test reporting
After you run a Performance test, a report with detailed data is available.
View the test report
Follow these steps:
- In the Performance tab, select Reports.
The drop-down list shows reports for Recent Test Runs. - Select either:
- One of the recent reports. The report will open.
- Click Show all reports. A list of all reports will appear on the left. To find your report, start typing the name in the search box and then select the report.
A test report overview opens.
If your report is set as a baseline, you will see it below the name. To learn more, see Baseline Comparison.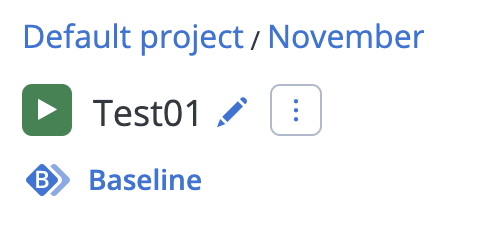
-
Select each of the tabs to view more report details.

To learn more about each tab, see:
- Summary Report
The main dashboard view of your test. Quickly access data such as Max Users, Average Throughput, Errors, Average Response Time, and Average Bandwidth. - Timeline Report
Displays the various types of Key Performance Indicators (KPIs) within one graph so you can easily visualize certain events that might have occurred throughout the test. - Request Stats Report
Displays the KPIs or metrics for each element of a test script, allowing you to drill down and review the statistics (stats) for how every single element of your test performed. - Engine Health Report
Displays performance indicators received from the test engines. Engine Health indicates whether the test infrastructure itself could be the cause of bottlenecks or the errors which are appearing in other reports. - Errors Report
Displays all errors received during the test run, categorized by labels (pages) and error types. - Logs Report
Displays the logs of each engine used during the test run. You can display and filter engines and logs, and then select multiple logs for download. - Original Test Configuration Report
Displays how your test was configured at the time the test covered by the report ran. This tab is especially useful if you have updated the test configuration since the report was run, as the details here will reflect the configuration prior to those updates. - Analyze and address anomalies with AI Anomaly Analysis
Use AI Anomaly Detection to help you identify errors in your tests and then recommend fixes. This feature is only available to Enterprise customers.
Quick search for reports
You can quickly search within the tab for reports by their name, without having to go through the Show All Reports side bar.
Follow these steps:
- Navigate to the Performance tab.
-
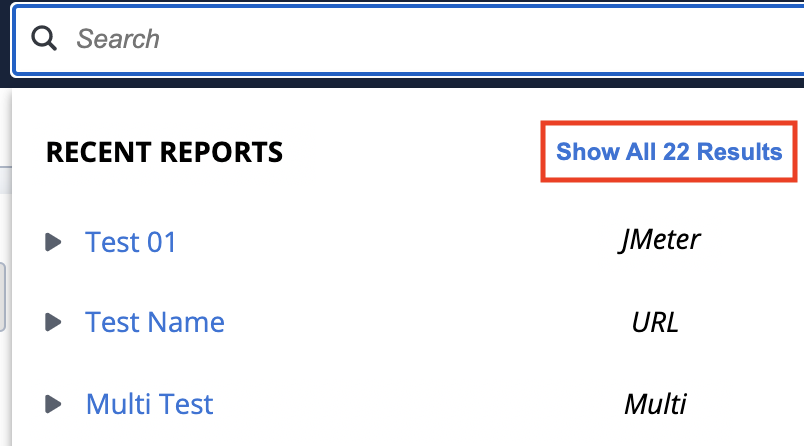
In the search field, enter a report name.
 The search is not case sensitive. The field displays top 5 recently executed reports that match your search.
 -
To see the full list of results, select Show All Results.
The side bar with Reports shows on the left. The reports are sorted by execution date.
Report header actions
In the header area of performance test reports, you can perform various actions to interact with the report and access different features. Some common actions include:
-
Navigate — You can navigate between different sections or tabs of the report, such as Timeline, Request Stats, Engine Health, Errors, and Summary.
-
Filtering Report Data — You can adjust the filter to manage the data displayed in the report.
-
Set a Report as a Baseline — You can select or set a baseline for comparison purposes. This helps you compare the current test run with a previous one to identify performance improvements or regressions.